Portuguese vs Vietnamese In Labor Force | Age 30-34
COMPARE
Portuguese
Vietnamese
In Labor Force | Age 30-34
In Labor Force | Age 30-34 Comparison
Portuguese
Vietnamese
84.0%
IN LABOR FORCE | AGE 30-34
0.8/ 100
METRIC RATING
248th/ 347
METRIC RANK
83.6%
IN LABOR FORCE | AGE 30-34
0.1/ 100
METRIC RATING
269th/ 347
METRIC RANK
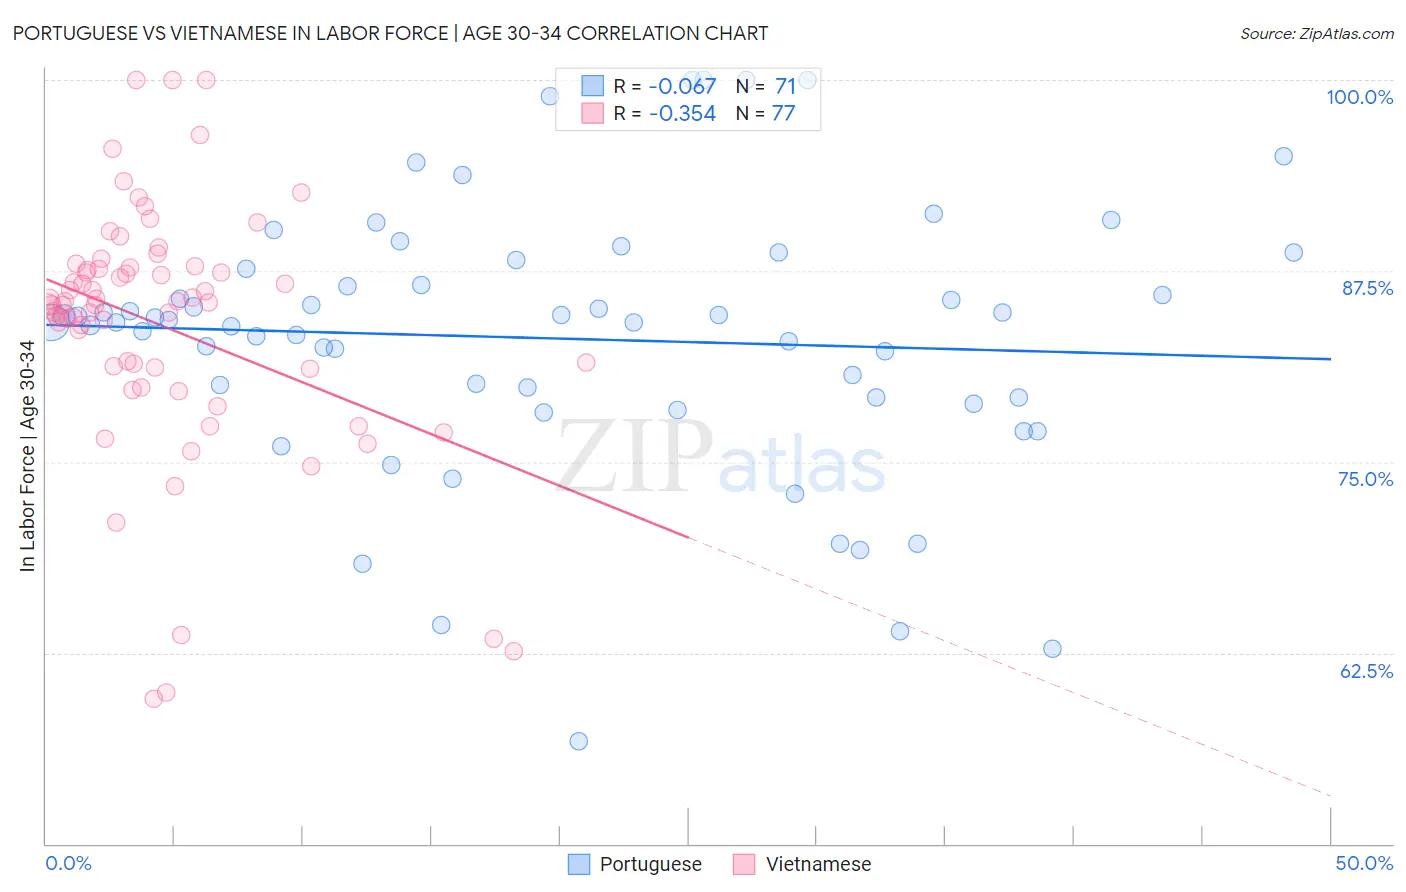
Portuguese vs Vietnamese In Labor Force | Age 30-34 Correlation Chart
The statistical analysis conducted on geographies consisting of 449,906,735 people shows a slight negative correlation between the proportion of Portuguese and labor force participation rate among population between the ages 30 and 34 in the United States with a correlation coefficient (R) of -0.067 and weighted average of 84.0%. Similarly, the statistical analysis conducted on geographies consisting of 170,686,461 people shows a mild negative correlation between the proportion of Vietnamese and labor force participation rate among population between the ages 30 and 34 in the United States with a correlation coefficient (R) of -0.354 and weighted average of 83.6%, a difference of 0.44%.
In Labor Force | Age 30-34 Correlation Summary
| Measurement | Portuguese | Vietnamese |
| Minimum | 56.7% | 59.5% |
| Maximum | 100.0% | 100.0% |
| Range | 43.3% | 40.5% |
| Mean | 83.1% | 83.9% |
| Median | 84.1% | 85.3% |
| Interquartile 25% (IQ1) | 79.2% | 81.1% |
| Interquartile 75% (IQ3) | 87.7% | 87.7% |
| Interquartile Range (IQR) | 8.5% | 6.6% |
| Standard Deviation (Sample) | 8.8% | 8.2% |
| Standard Deviation (Population) | 8.7% | 8.1% |
Similar Demographics by In Labor Force | Age 30-34
Demographics Similar to Portuguese by In Labor Force | Age 30-34
In terms of in labor force | age 30-34, the demographic groups most similar to Portuguese are Immigrants from Dominica (84.0%, a difference of 0.0%), British West Indian (84.0%, a difference of 0.010%), Immigrants from Iraq (83.9%, a difference of 0.020%), Basque (84.0%, a difference of 0.030%), and Immigrants from Venezuela (84.0%, a difference of 0.030%).
| Demographics | Rating | Rank | In Labor Force | Age 30-34 |
| Immigrants | Portugal | 1.2 /100 | #241 | Tragic 84.0% |
| Immigrants | Oceania | 1.1 /100 | #242 | Tragic 84.0% |
| Immigrants | Caribbean | 1.1 /100 | #243 | Tragic 84.0% |
| Basques | 0.9 /100 | #244 | Tragic 84.0% |
| Immigrants | Venezuela | 0.9 /100 | #245 | Tragic 84.0% |
| Central Americans | 0.9 /100 | #246 | Tragic 84.0% |
| British West Indians | 0.8 /100 | #247 | Tragic 84.0% |
| Portuguese | 0.8 /100 | #248 | Tragic 84.0% |
| Immigrants | Dominica | 0.7 /100 | #249 | Tragic 84.0% |
| Immigrants | Iraq | 0.7 /100 | #250 | Tragic 83.9% |
| Nicaraguans | 0.6 /100 | #251 | Tragic 83.9% |
| Bahamians | 0.6 /100 | #252 | Tragic 83.9% |
| Immigrants | Nicaragua | 0.6 /100 | #253 | Tragic 83.9% |
| Immigrants | St. Vincent and the Grenadines | 0.5 /100 | #254 | Tragic 83.9% |
| Whites/Caucasians | 0.5 /100 | #255 | Tragic 83.9% |
Demographics Similar to Vietnamese by In Labor Force | Age 30-34
In terms of in labor force | age 30-34, the demographic groups most similar to Vietnamese are Immigrants from Bangladesh (83.6%, a difference of 0.010%), Spaniard (83.6%, a difference of 0.020%), Spanish American (83.5%, a difference of 0.050%), Spanish (83.5%, a difference of 0.070%), and Nonimmigrants (83.5%, a difference of 0.070%).
| Demographics | Rating | Rank | In Labor Force | Age 30-34 |
| Dominicans | 0.2 /100 | #262 | Tragic 83.8% |
| Immigrants | Guyana | 0.2 /100 | #263 | Tragic 83.8% |
| Guatemalans | 0.2 /100 | #264 | Tragic 83.7% |
| Immigrants | Honduras | 0.1 /100 | #265 | Tragic 83.7% |
| Immigrants | Guatemala | 0.1 /100 | #266 | Tragic 83.7% |
| Spaniards | 0.1 /100 | #267 | Tragic 83.6% |
| Immigrants | Bangladesh | 0.1 /100 | #268 | Tragic 83.6% |
| Vietnamese | 0.1 /100 | #269 | Tragic 83.6% |
| Spanish Americans | 0.0 /100 | #270 | Tragic 83.5% |
| Spanish | 0.0 /100 | #271 | Tragic 83.5% |
| Immigrants | Nonimmigrants | 0.0 /100 | #272 | Tragic 83.5% |
| Guamanians/Chamorros | 0.0 /100 | #273 | Tragic 83.5% |
| Belizeans | 0.0 /100 | #274 | Tragic 83.5% |
| Immigrants | Grenada | 0.0 /100 | #275 | Tragic 83.5% |
| Tongans | 0.0 /100 | #276 | Tragic 83.5% |