Portuguese vs Sudanese Bachelor's Degree
COMPARE
Portuguese
Sudanese
Bachelor's Degree
Bachelor's Degree Comparison
Portuguese
Sudanese
35.5%
BACHELOR'S DEGREE
7.2/ 100
METRIC RATING
226th/ 347
METRIC RANK
38.9%
BACHELOR'S DEGREE
76.4/ 100
METRIC RATING
152nd/ 347
METRIC RANK
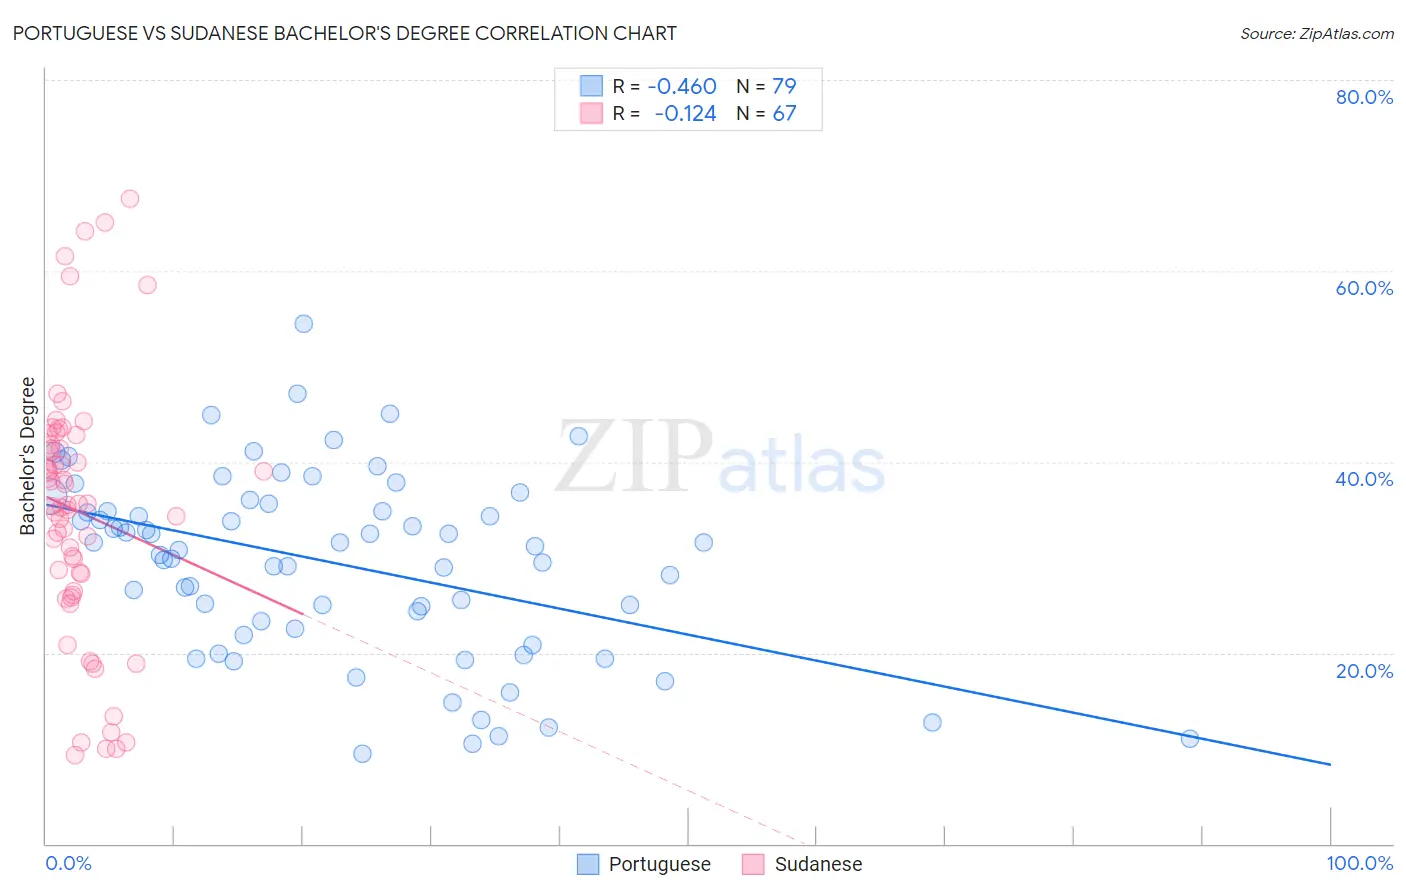
Portuguese vs Sudanese Bachelor's Degree Correlation Chart
The statistical analysis conducted on geographies consisting of 450,314,752 people shows a moderate negative correlation between the proportion of Portuguese and percentage of population with at least bachelor's degree education in the United States with a correlation coefficient (R) of -0.460 and weighted average of 35.5%. Similarly, the statistical analysis conducted on geographies consisting of 110,140,841 people shows a poor negative correlation between the proportion of Sudanese and percentage of population with at least bachelor's degree education in the United States with a correlation coefficient (R) of -0.124 and weighted average of 38.9%, a difference of 9.7%.
Bachelor's Degree Correlation Summary
| Measurement | Portuguese | Sudanese |
| Minimum | 9.4% | 9.3% |
| Maximum | 54.4% | 67.6% |
| Range | 45.0% | 58.3% |
| Mean | 29.4% | 34.8% |
| Median | 31.1% | 35.5% |
| Interquartile 25% (IQ1) | 22.5% | 26.5% |
| Interquartile 75% (IQ3) | 35.6% | 41.8% |
| Interquartile Range (IQR) | 13.1% | 15.3% |
| Standard Deviation (Sample) | 9.6% | 13.4% |
| Standard Deviation (Population) | 9.5% | 13.3% |
Similar Demographics by Bachelor's Degree
Demographics Similar to Portuguese by Bachelor's Degree
In terms of bachelor's degree, the demographic groups most similar to Portuguese are Immigrants from Burma/Myanmar (35.5%, a difference of 0.040%), Immigrants from Barbados (35.5%, a difference of 0.11%), Ecuadorian (35.4%, a difference of 0.26%), French Canadian (35.6%, a difference of 0.38%), and Immigrants from Trinidad and Tobago (35.3%, a difference of 0.49%).
| Demographics | Rating | Rank | Bachelor's Degree |
| West Indians | 9.7 /100 | #219 | Tragic 35.8% |
| Spanish | 9.6 /100 | #220 | Tragic 35.8% |
| Dutch | 9.2 /100 | #221 | Tragic 35.7% |
| Trinidadians and Tobagonians | 8.8 /100 | #222 | Tragic 35.7% |
| French Canadians | 8.3 /100 | #223 | Tragic 35.6% |
| Immigrants | Barbados | 7.5 /100 | #224 | Tragic 35.5% |
| Immigrants | Burma/Myanmar | 7.3 /100 | #225 | Tragic 35.5% |
| Portuguese | 7.2 /100 | #226 | Tragic 35.5% |
| Ecuadorians | 6.6 /100 | #227 | Tragic 35.4% |
| Immigrants | Trinidad and Tobago | 6.0 /100 | #228 | Tragic 35.3% |
| Whites/Caucasians | 5.9 /100 | #229 | Tragic 35.3% |
| Immigrants | Grenada | 4.3 /100 | #230 | Tragic 35.0% |
| Immigrants | St. Vincent and the Grenadines | 4.3 /100 | #231 | Tragic 35.0% |
| Hmong | 3.4 /100 | #232 | Tragic 34.8% |
| Immigrants | Ecuador | 3.3 /100 | #233 | Tragic 34.7% |
Demographics Similar to Sudanese by Bachelor's Degree
In terms of bachelor's degree, the demographic groups most similar to Sudanese are Immigrants from Africa (38.9%, a difference of 0.020%), Slavic (38.9%, a difference of 0.060%), South American (38.9%, a difference of 0.12%), Immigrants from Poland (39.0%, a difference of 0.15%), and Canadian (38.8%, a difference of 0.18%).
| Demographics | Rating | Rank | Bachelor's Degree |
| Slovenes | 79.5 /100 | #145 | Good 39.1% |
| Swedes | 79.2 /100 | #146 | Good 39.1% |
| Immigrants | Sierra Leone | 79.0 /100 | #147 | Good 39.0% |
| Iraqis | 78.1 /100 | #148 | Good 39.0% |
| Immigrants | Poland | 77.5 /100 | #149 | Good 39.0% |
| South Americans | 77.3 /100 | #150 | Good 38.9% |
| Immigrants | Africa | 76.5 /100 | #151 | Good 38.9% |
| Sudanese | 76.4 /100 | #152 | Good 38.9% |
| Slavs | 75.9 /100 | #153 | Good 38.9% |
| Canadians | 75.0 /100 | #154 | Good 38.8% |
| Immigrants | Kenya | 73.8 /100 | #155 | Good 38.8% |
| Kenyans | 72.5 /100 | #156 | Good 38.7% |
| Immigrants | South America | 70.1 /100 | #157 | Good 38.6% |
| Immigrants | Germany | 69.6 /100 | #158 | Good 38.6% |
| Chinese | 66.6 /100 | #159 | Good 38.5% |