Immigrants from Turkey vs Nigerian Doctorate Degree
COMPARE
Immigrants from Turkey
Nigerian
Doctorate Degree
Doctorate Degree Comparison
Immigrants from Turkey
Nigerians
2.6%
DOCTORATE DEGREE
100.0/ 100
METRIC RATING
27th/ 347
METRIC RANK
1.8%
DOCTORATE DEGREE
39.9/ 100
METRIC RATING
184th/ 347
METRIC RANK
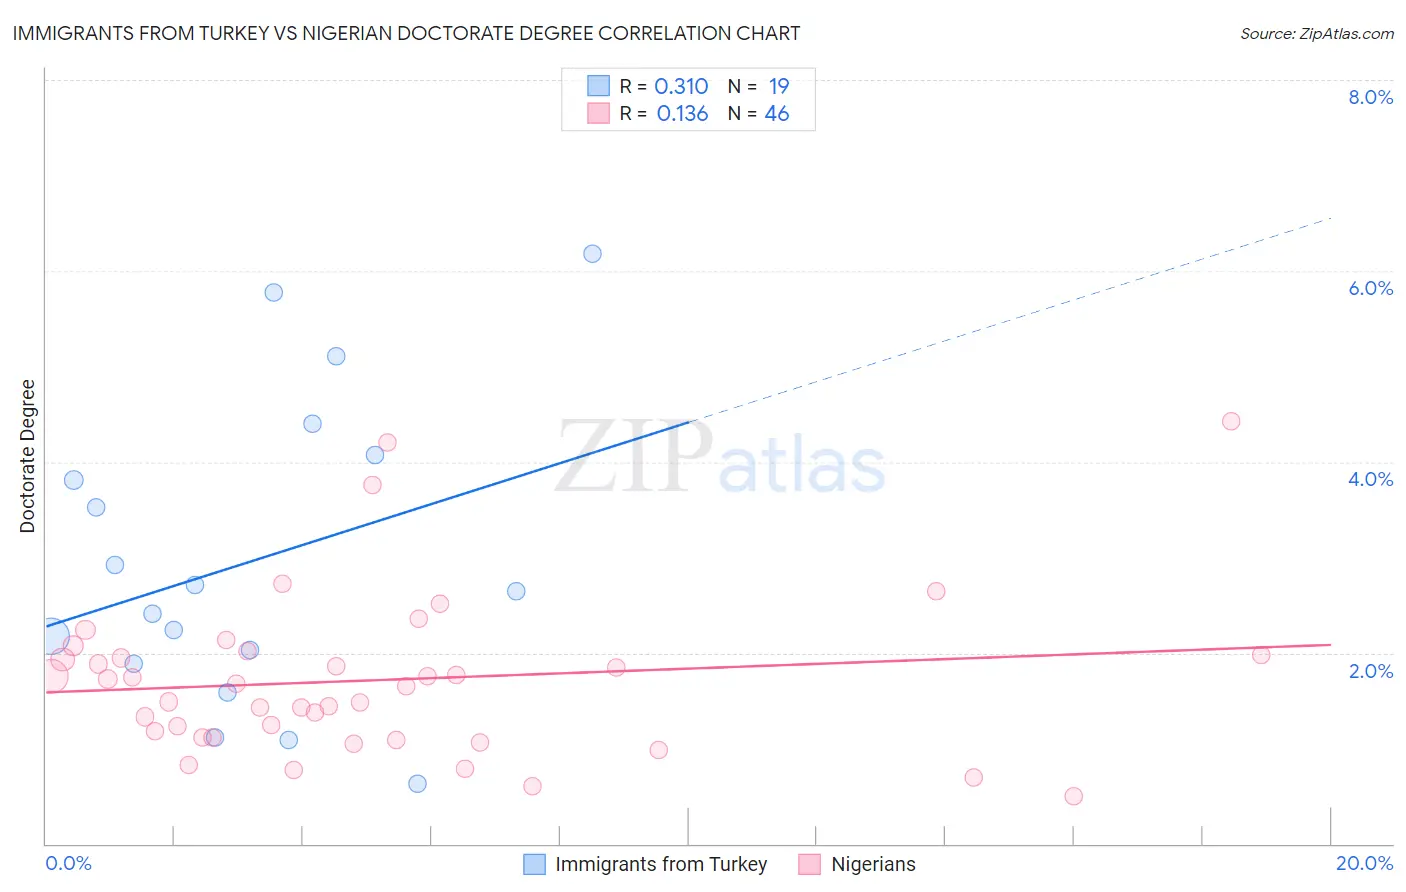
Immigrants from Turkey vs Nigerian Doctorate Degree Correlation Chart
The statistical analysis conducted on geographies consisting of 222,587,389 people shows a mild positive correlation between the proportion of Immigrants from Turkey and percentage of population with at least doctorate degree education in the United States with a correlation coefficient (R) of 0.310 and weighted average of 2.6%. Similarly, the statistical analysis conducted on geographies consisting of 330,548,199 people shows a poor positive correlation between the proportion of Nigerians and percentage of population with at least doctorate degree education in the United States with a correlation coefficient (R) of 0.136 and weighted average of 1.8%, a difference of 46.0%.
Doctorate Degree Correlation Summary
| Measurement | Immigrants from Turkey | Nigerian |
| Minimum | 0.63% | 0.50% |
| Maximum | 6.2% | 4.4% |
| Range | 5.6% | 3.9% |
| Mean | 3.0% | 1.7% |
| Median | 2.6% | 1.7% |
| Interquartile 25% (IQ1) | 1.9% | 1.1% |
| Interquartile 75% (IQ3) | 4.1% | 2.0% |
| Interquartile Range (IQR) | 2.2% | 0.87% |
| Standard Deviation (Sample) | 1.6% | 0.84% |
| Standard Deviation (Population) | 1.5% | 0.83% |
Similar Demographics by Doctorate Degree
Demographics Similar to Immigrants from Turkey by Doctorate Degree
In terms of doctorate degree, the demographic groups most similar to Immigrants from Turkey are Burmese (2.6%, a difference of 0.30%), Immigrants from South Central Asia (2.6%, a difference of 0.57%), Immigrants from Korea (2.6%, a difference of 0.61%), Turkish (2.7%, a difference of 0.87%), and Immigrants from Saudi Arabia (2.7%, a difference of 1.4%).
| Demographics | Rating | Rank | Doctorate Degree |
| Immigrants | Hong Kong | 100.0 /100 | #20 | Exceptional 2.8% |
| Thais | 100.0 /100 | #21 | Exceptional 2.8% |
| Mongolians | 100.0 /100 | #22 | Exceptional 2.8% |
| Immigrants | Denmark | 100.0 /100 | #23 | Exceptional 2.8% |
| Israelis | 100.0 /100 | #24 | Exceptional 2.7% |
| Immigrants | Saudi Arabia | 100.0 /100 | #25 | Exceptional 2.7% |
| Turks | 100.0 /100 | #26 | Exceptional 2.7% |
| Immigrants | Turkey | 100.0 /100 | #27 | Exceptional 2.6% |
| Burmese | 100.0 /100 | #28 | Exceptional 2.6% |
| Immigrants | South Central Asia | 100.0 /100 | #29 | Exceptional 2.6% |
| Immigrants | Korea | 100.0 /100 | #30 | Exceptional 2.6% |
| Latvians | 100.0 /100 | #31 | Exceptional 2.6% |
| Immigrants | Northern Europe | 100.0 /100 | #32 | Exceptional 2.6% |
| Cambodians | 100.0 /100 | #33 | Exceptional 2.6% |
| Cypriots | 100.0 /100 | #34 | Exceptional 2.6% |
Demographics Similar to Nigerians by Doctorate Degree
In terms of doctorate degree, the demographic groups most similar to Nigerians are Finnish (1.8%, a difference of 0.33%), Slovak (1.8%, a difference of 0.57%), Immigrants from Afghanistan (1.8%, a difference of 0.66%), Peruvian (1.8%, a difference of 0.89%), and Immigrants (1.8%, a difference of 0.96%).
| Demographics | Rating | Rank | Doctorate Degree |
| Iraqis | 49.2 /100 | #177 | Average 1.8% |
| French | 48.8 /100 | #178 | Average 1.8% |
| Ghanaians | 48.3 /100 | #179 | Average 1.8% |
| Scandinavians | 48.0 /100 | #180 | Average 1.8% |
| Immigrants | Immigrants | 46.2 /100 | #181 | Average 1.8% |
| Immigrants | Afghanistan | 44.3 /100 | #182 | Average 1.8% |
| Finns | 42.1 /100 | #183 | Average 1.8% |
| Nigerians | 39.9 /100 | #184 | Fair 1.8% |
| Slovaks | 36.4 /100 | #185 | Fair 1.8% |
| Peruvians | 34.4 /100 | #186 | Fair 1.8% |
| Czechoslovakians | 33.0 /100 | #187 | Fair 1.8% |
| Germans | 30.5 /100 | #188 | Fair 1.8% |
| French Canadians | 30.2 /100 | #189 | Fair 1.8% |
| Immigrants | Costa Rica | 30.2 /100 | #190 | Fair 1.8% |
| South Americans | 29.5 /100 | #191 | Fair 1.8% |