U.S. Virgin Islander vs Immigrants from Serbia 11th Grade
COMPARE
U.S. Virgin Islander
Immigrants from Serbia
11th Grade
11th Grade Comparison
U.S. Virgin Islanders
Immigrants from Serbia
91.1%
11TH GRADE
0.2/ 100
METRIC RATING
268th/ 347
METRIC RANK
93.5%
11TH GRADE
98.6/ 100
METRIC RATING
105th/ 347
METRIC RANK
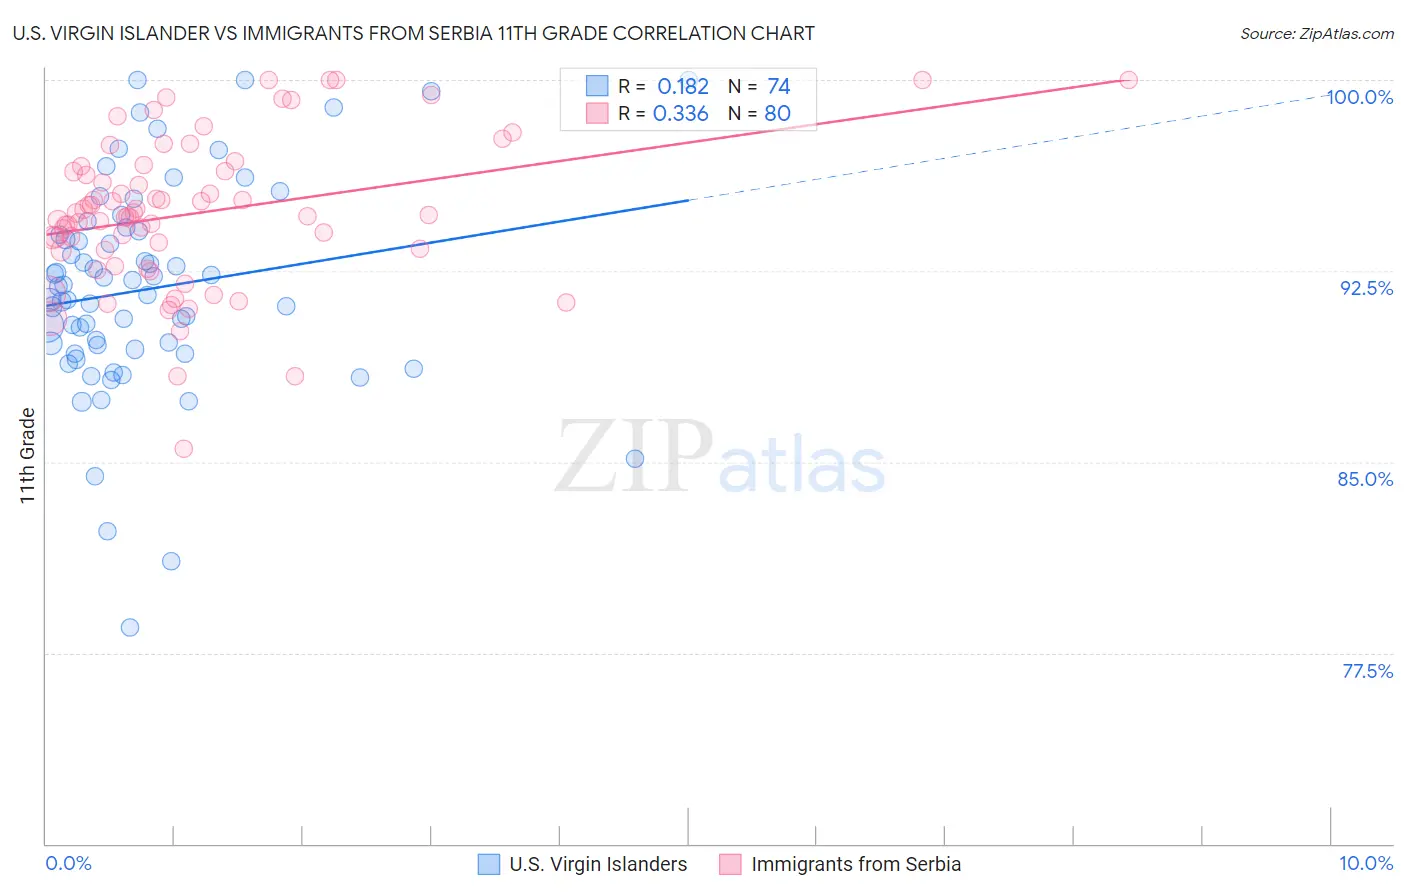
U.S. Virgin Islander vs Immigrants from Serbia 11th Grade Correlation Chart
The statistical analysis conducted on geographies consisting of 87,529,315 people shows a poor positive correlation between the proportion of U.S. Virgin Islanders and percentage of population with at least 11th grade education in the United States with a correlation coefficient (R) of 0.182 and weighted average of 91.1%. Similarly, the statistical analysis conducted on geographies consisting of 131,745,658 people shows a mild positive correlation between the proportion of Immigrants from Serbia and percentage of population with at least 11th grade education in the United States with a correlation coefficient (R) of 0.336 and weighted average of 93.5%, a difference of 2.6%.
11th Grade Correlation Summary
| Measurement | U.S. Virgin Islander | Immigrants from Serbia |
| Minimum | 78.5% | 85.5% |
| Maximum | 100.0% | 100.0% |
| Range | 21.5% | 14.5% |
| Mean | 91.8% | 94.8% |
| Median | 91.7% | 94.7% |
| Interquartile 25% (IQ1) | 89.4% | 93.3% |
| Interquartile 75% (IQ3) | 94.1% | 96.5% |
| Interquartile Range (IQR) | 4.7% | 3.2% |
| Standard Deviation (Sample) | 4.2% | 2.9% |
| Standard Deviation (Population) | 4.2% | 2.9% |
Similar Demographics by 11th Grade
Demographics Similar to U.S. Virgin Islanders by 11th Grade
In terms of 11th grade, the demographic groups most similar to U.S. Virgin Islanders are Ute (91.1%, a difference of 0.030%), Trinidadian and Tobagonian (91.1%, a difference of 0.060%), Immigrants from Jamaica (91.2%, a difference of 0.070%), Immigrants from Western Africa (91.2%, a difference of 0.080%), and Immigrants from Peru (91.0%, a difference of 0.090%).
| Demographics | Rating | Rank | 11th Grade |
| Taiwanese | 0.6 /100 | #261 | Tragic 91.3% |
| Immigrants | Uruguay | 0.5 /100 | #262 | Tragic 91.3% |
| Immigrants | Ghana | 0.3 /100 | #263 | Tragic 91.2% |
| Yup'ik | 0.3 /100 | #264 | Tragic 91.2% |
| Pueblo | 0.3 /100 | #265 | Tragic 91.2% |
| Immigrants | Western Africa | 0.3 /100 | #266 | Tragic 91.2% |
| Immigrants | Jamaica | 0.3 /100 | #267 | Tragic 91.2% |
| U.S. Virgin Islanders | 0.2 /100 | #268 | Tragic 91.1% |
| Ute | 0.2 /100 | #269 | Tragic 91.1% |
| Trinidadians and Tobagonians | 0.2 /100 | #270 | Tragic 91.1% |
| Immigrants | Peru | 0.1 /100 | #271 | Tragic 91.0% |
| West Indians | 0.1 /100 | #272 | Tragic 91.0% |
| Paiute | 0.1 /100 | #273 | Tragic 91.0% |
| Immigrants | Trinidad and Tobago | 0.1 /100 | #274 | Tragic 90.9% |
| Immigrants | South Eastern Asia | 0.1 /100 | #275 | Tragic 90.9% |
Demographics Similar to Immigrants from Serbia by 11th Grade
In terms of 11th grade, the demographic groups most similar to Immigrants from Serbia are Chippewa (93.5%, a difference of 0.0%), Lebanese (93.5%, a difference of 0.0%), Immigrants from Europe (93.5%, a difference of 0.0%), Immigrants from Croatia (93.5%, a difference of 0.0%), and Immigrants from Romania (93.5%, a difference of 0.010%).
| Demographics | Rating | Rank | 11th Grade |
| Immigrants | Israel | 98.8 /100 | #98 | Exceptional 93.5% |
| Menominee | 98.7 /100 | #99 | Exceptional 93.5% |
| Immigrants | North Macedonia | 98.7 /100 | #100 | Exceptional 93.5% |
| Immigrants | Romania | 98.7 /100 | #101 | Exceptional 93.5% |
| Chippewa | 98.6 /100 | #102 | Exceptional 93.5% |
| Lebanese | 98.6 /100 | #103 | Exceptional 93.5% |
| Immigrants | Europe | 98.6 /100 | #104 | Exceptional 93.5% |
| Immigrants | Serbia | 98.6 /100 | #105 | Exceptional 93.5% |
| Immigrants | Croatia | 98.6 /100 | #106 | Exceptional 93.5% |
| Immigrants | Norway | 98.4 /100 | #107 | Exceptional 93.5% |
| Alaska Natives | 98.4 /100 | #108 | Exceptional 93.5% |
| Immigrants | Kuwait | 98.4 /100 | #109 | Exceptional 93.5% |
| Syrians | 98.4 /100 | #110 | Exceptional 93.4% |
| Yugoslavians | 98.1 /100 | #111 | Exceptional 93.4% |
| Immigrants | Germany | 98.0 /100 | #112 | Exceptional 93.4% |