Portuguese vs Uruguayan 11th Grade
COMPARE
Portuguese
Uruguayan
11th Grade
11th Grade Comparison
Portuguese
Uruguayans
92.0%
11TH GRADE
10.0/ 100
METRIC RATING
219th/ 347
METRIC RANK
91.8%
11TH GRADE
3.5/ 100
METRIC RATING
232nd/ 347
METRIC RANK
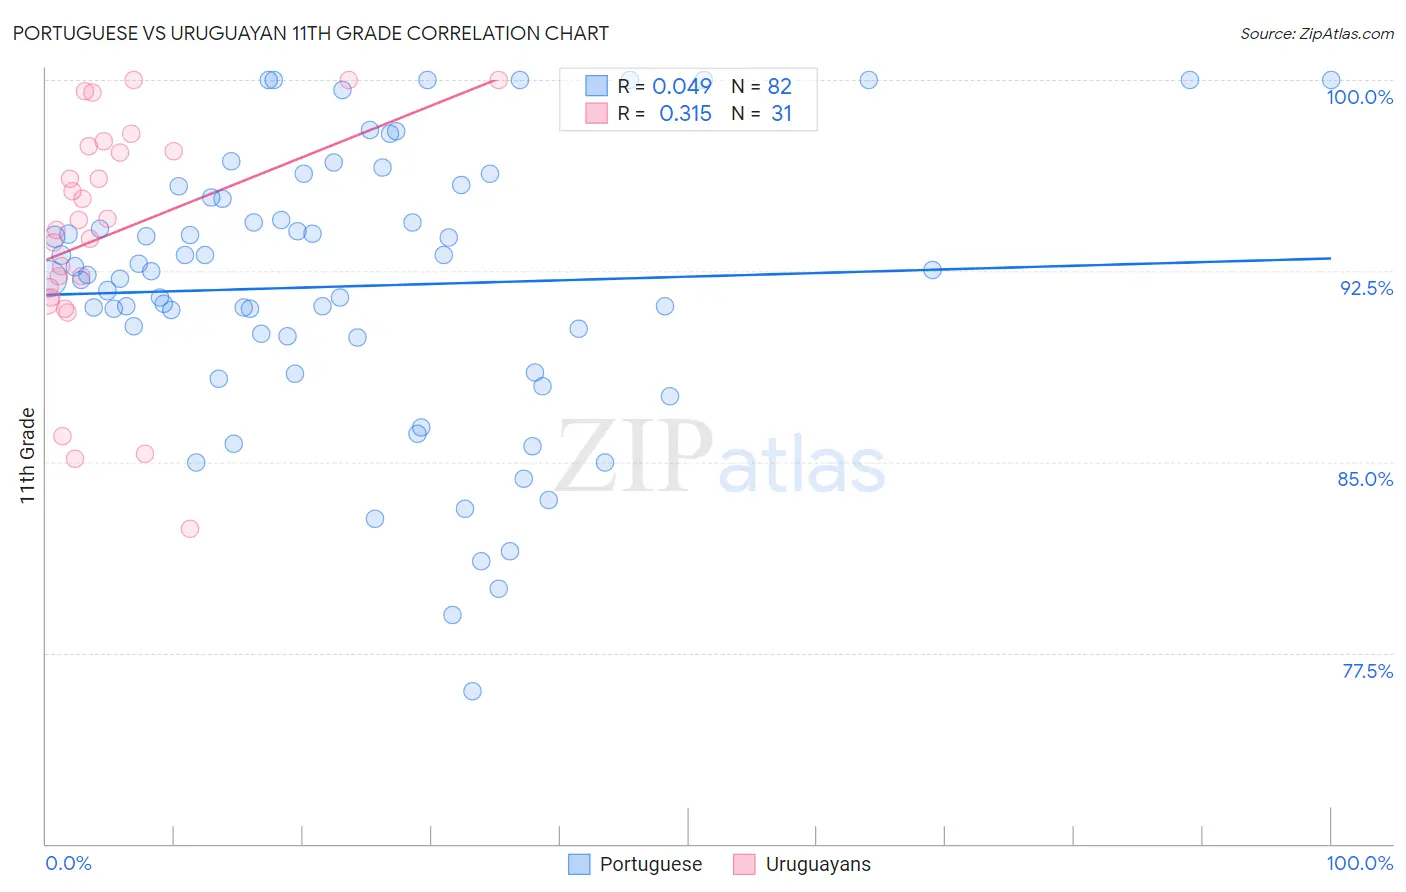
Portuguese vs Uruguayan 11th Grade Correlation Chart
The statistical analysis conducted on geographies consisting of 450,351,764 people shows no correlation between the proportion of Portuguese and percentage of population with at least 11th grade education in the United States with a correlation coefficient (R) of 0.049 and weighted average of 92.0%. Similarly, the statistical analysis conducted on geographies consisting of 144,782,615 people shows a mild positive correlation between the proportion of Uruguayans and percentage of population with at least 11th grade education in the United States with a correlation coefficient (R) of 0.315 and weighted average of 91.8%, a difference of 0.28%.
11th Grade Correlation Summary
| Measurement | Portuguese | Uruguayan |
| Minimum | 76.0% | 82.4% |
| Maximum | 100.0% | 100.0% |
| Range | 24.0% | 17.6% |
| Mean | 91.9% | 94.0% |
| Median | 92.4% | 94.5% |
| Interquartile 25% (IQ1) | 89.9% | 91.5% |
| Interquartile 75% (IQ3) | 95.4% | 97.4% |
| Interquartile Range (IQR) | 5.5% | 5.9% |
| Standard Deviation (Sample) | 5.4% | 4.6% |
| Standard Deviation (Population) | 5.4% | 4.6% |
Demographics Similar to Portuguese and Uruguayans by 11th Grade
In terms of 11th grade, the demographic groups most similar to Portuguese are Blackfeet (92.0%, a difference of 0.0%), Immigrants from Sierra Leone (92.0%, a difference of 0.030%), Somali (92.1%, a difference of 0.040%), Immigrants from Southern Europe (92.1%, a difference of 0.060%), and South American Indian (92.0%, a difference of 0.070%). Similarly, the demographic groups most similar to Uruguayans are Cheyenne (91.8%, a difference of 0.010%), Choctaw (91.8%, a difference of 0.020%), Immigrants from Afghanistan (91.8%, a difference of 0.030%), Armenian (91.7%, a difference of 0.040%), and Nigerian (91.8%, a difference of 0.050%).
| Demographics | Rating | Rank | 11th Grade |
| Immigrants | Southern Europe | 12.5 /100 | #215 | Poor 92.1% |
| Somalis | 11.6 /100 | #216 | Poor 92.1% |
| Immigrants | Sierra Leone | 11.1 /100 | #217 | Poor 92.0% |
| Blackfeet | 10.1 /100 | #218 | Poor 92.0% |
| Portuguese | 10.0 /100 | #219 | Tragic 92.0% |
| South American Indians | 7.6 /100 | #220 | Tragic 92.0% |
| Immigrants | Liberia | 7.0 /100 | #221 | Tragic 91.9% |
| Immigrants | Africa | 6.5 /100 | #222 | Tragic 91.9% |
| Immigrants | Bahamas | 6.5 /100 | #223 | Tragic 91.9% |
| Costa Ricans | 6.3 /100 | #224 | Tragic 91.9% |
| Immigrants | Zaire | 5.4 /100 | #225 | Tragic 91.9% |
| Immigrants | Somalia | 5.2 /100 | #226 | Tragic 91.9% |
| Immigrants | Cameroon | 4.4 /100 | #227 | Tragic 91.8% |
| Immigrants | Panama | 4.3 /100 | #228 | Tragic 91.8% |
| Nigerians | 4.3 /100 | #229 | Tragic 91.8% |
| Immigrants | Afghanistan | 3.9 /100 | #230 | Tragic 91.8% |
| Choctaw | 3.7 /100 | #231 | Tragic 91.8% |
| Uruguayans | 3.5 /100 | #232 | Tragic 91.8% |
| Cheyenne | 3.3 /100 | #233 | Tragic 91.8% |
| Armenians | 2.9 /100 | #234 | Tragic 91.7% |
| Sub-Saharan Africans | 2.9 /100 | #235 | Tragic 91.7% |