Cape Verdean vs Norwegian No Schooling Completed
COMPARE
Cape Verdean
Norwegian
No Schooling Completed
No Schooling Completed Comparison
Cape Verdeans
Norwegians
3.1%
NO SCHOOLING COMPLETED
0.0/ 100
METRIC RATING
317th/ 347
METRIC RANK
1.3%
NO SCHOOLING COMPLETED
100.0/ 100
METRIC RATING
3rd/ 347
METRIC RANK
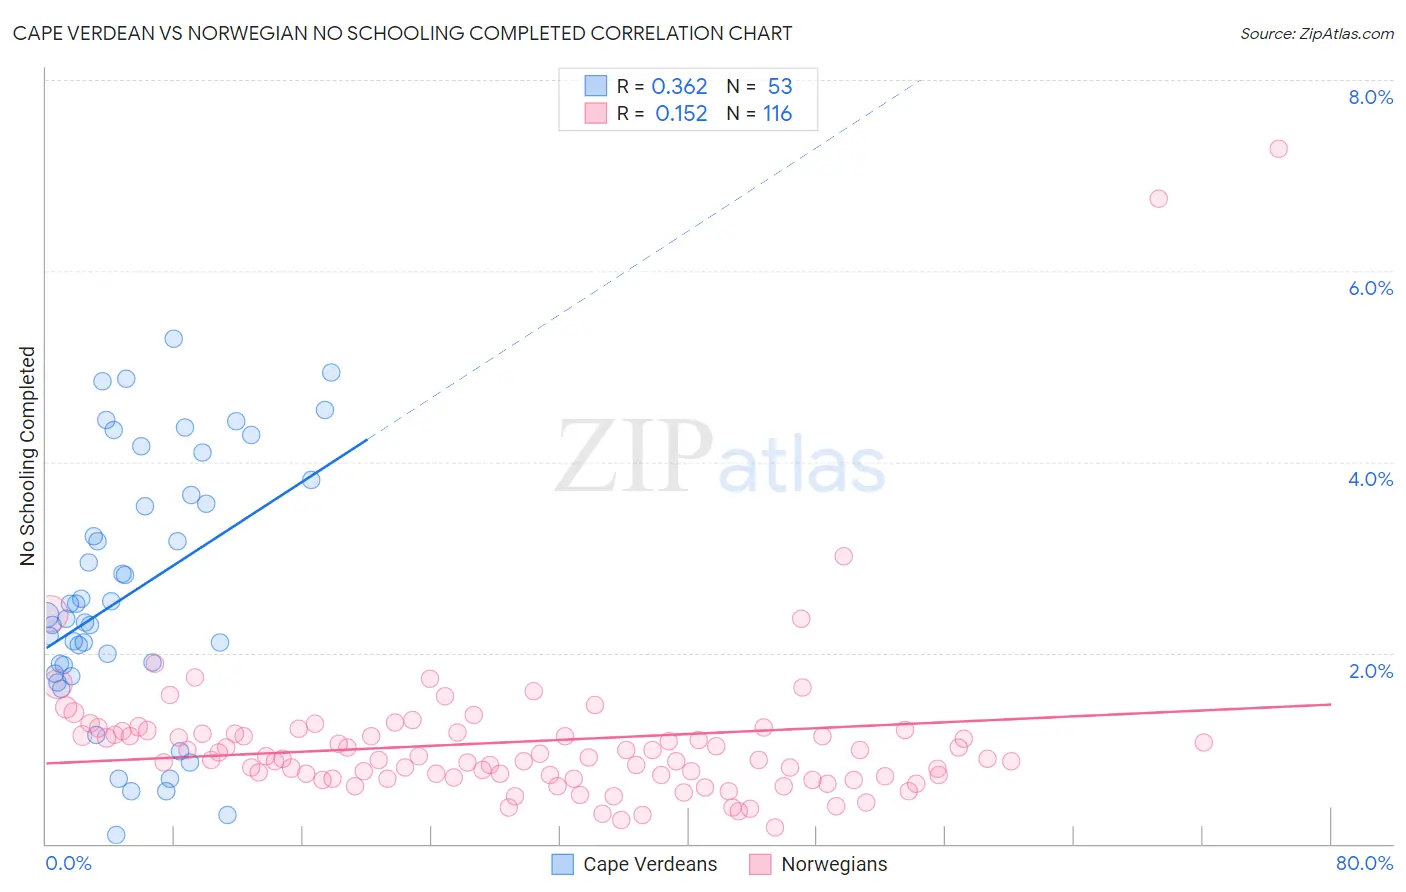
Cape Verdean vs Norwegian No Schooling Completed Correlation Chart
The statistical analysis conducted on geographies consisting of 107,247,027 people shows a mild positive correlation between the proportion of Cape Verdeans and percentage of population with no schooling in the United States with a correlation coefficient (R) of 0.362 and weighted average of 3.1%. Similarly, the statistical analysis conducted on geographies consisting of 518,592,582 people shows a poor positive correlation between the proportion of Norwegians and percentage of population with no schooling in the United States with a correlation coefficient (R) of 0.152 and weighted average of 1.3%, a difference of 129.9%.
No Schooling Completed Correlation Summary
| Measurement | Cape Verdean | Norwegian |
| Minimum | 0.088% | 0.17% |
| Maximum | 5.3% | 7.3% |
| Range | 5.2% | 7.1% |
| Mean | 2.6% | 1.1% |
| Median | 2.4% | 0.89% |
| Interquartile 25% (IQ1) | 1.8% | 0.70% |
| Interquartile 75% (IQ3) | 3.7% | 1.2% |
| Interquartile Range (IQR) | 1.9% | 0.46% |
| Standard Deviation (Sample) | 1.3% | 0.90% |
| Standard Deviation (Population) | 1.3% | 0.90% |
Similar Demographics by No Schooling Completed
Demographics Similar to Cape Verdeans by No Schooling Completed
In terms of no schooling completed, the demographic groups most similar to Cape Verdeans are Immigrants from Ecuador (3.1%, a difference of 0.49%), Immigrants from Guyana (3.1%, a difference of 0.68%), Immigrants from Nicaragua (3.1%, a difference of 0.84%), Immigrants from Belize (3.1%, a difference of 1.1%), and Honduran (3.1%, a difference of 1.2%).
| Demographics | Rating | Rank | No Schooling Completed |
| Guyanese | 0.0 /100 | #310 | Tragic 3.0% |
| Immigrants | Azores | 0.0 /100 | #311 | Tragic 3.0% |
| Sri Lankans | 0.0 /100 | #312 | Tragic 3.0% |
| Hondurans | 0.0 /100 | #313 | Tragic 3.1% |
| Immigrants | Belize | 0.0 /100 | #314 | Tragic 3.1% |
| Immigrants | Nicaragua | 0.0 /100 | #315 | Tragic 3.1% |
| Immigrants | Ecuador | 0.0 /100 | #316 | Tragic 3.1% |
| Cape Verdeans | 0.0 /100 | #317 | Tragic 3.1% |
| Immigrants | Guyana | 0.0 /100 | #318 | Tragic 3.1% |
| Immigrants | Burma/Myanmar | 0.0 /100 | #319 | Tragic 3.1% |
| Immigrants | Bangladesh | 0.0 /100 | #320 | Tragic 3.1% |
| Immigrants | Laos | 0.0 /100 | #321 | Tragic 3.1% |
| Immigrants | Honduras | 0.0 /100 | #322 | Tragic 3.2% |
| Vietnamese | 0.0 /100 | #323 | Tragic 3.2% |
| Mexican American Indians | 0.0 /100 | #324 | Tragic 3.2% |
Demographics Similar to Norwegians by No Schooling Completed
In terms of no schooling completed, the demographic groups most similar to Norwegians are Slovak (1.3%, a difference of 0.43%), German (1.4%, a difference of 0.56%), Slovene (1.4%, a difference of 0.98%), Carpatho Rusyn (1.4%, a difference of 1.8%), and English (1.4%, a difference of 2.8%).
| Demographics | Rating | Rank | No Schooling Completed |
| Yup'ik | 100.0 /100 | #1 | Exceptional 1.2% |
| Slovaks | 100.0 /100 | #2 | Exceptional 1.3% |
| Norwegians | 100.0 /100 | #3 | Exceptional 1.3% |
| Germans | 100.0 /100 | #4 | Exceptional 1.4% |
| Slovenes | 100.0 /100 | #5 | Exceptional 1.4% |
| Carpatho Rusyns | 100.0 /100 | #6 | Exceptional 1.4% |
| English | 100.0 /100 | #7 | Exceptional 1.4% |
| Swedes | 100.0 /100 | #8 | Exceptional 1.4% |
| Scottish | 100.0 /100 | #9 | Exceptional 1.4% |
| Dutch | 100.0 /100 | #10 | Exceptional 1.4% |
| Lithuanians | 100.0 /100 | #11 | Exceptional 1.4% |
| Irish | 100.0 /100 | #12 | Exceptional 1.4% |
| Poles | 100.0 /100 | #13 | Exceptional 1.4% |
| Scotch-Irish | 100.0 /100 | #14 | Exceptional 1.5% |
| Tlingit-Haida | 100.0 /100 | #15 | Exceptional 1.5% |