Ute vs Immigrants from Zimbabwe 5th Grade
COMPARE
Ute
Immigrants from Zimbabwe
5th Grade
5th Grade Comparison
Ute
Immigrants from Zimbabwe
97.4%
5TH GRADE
74.9/ 100
METRIC RATING
152nd/ 347
METRIC RANK
97.6%
5TH GRADE
94.9/ 100
METRIC RATING
120th/ 347
METRIC RANK
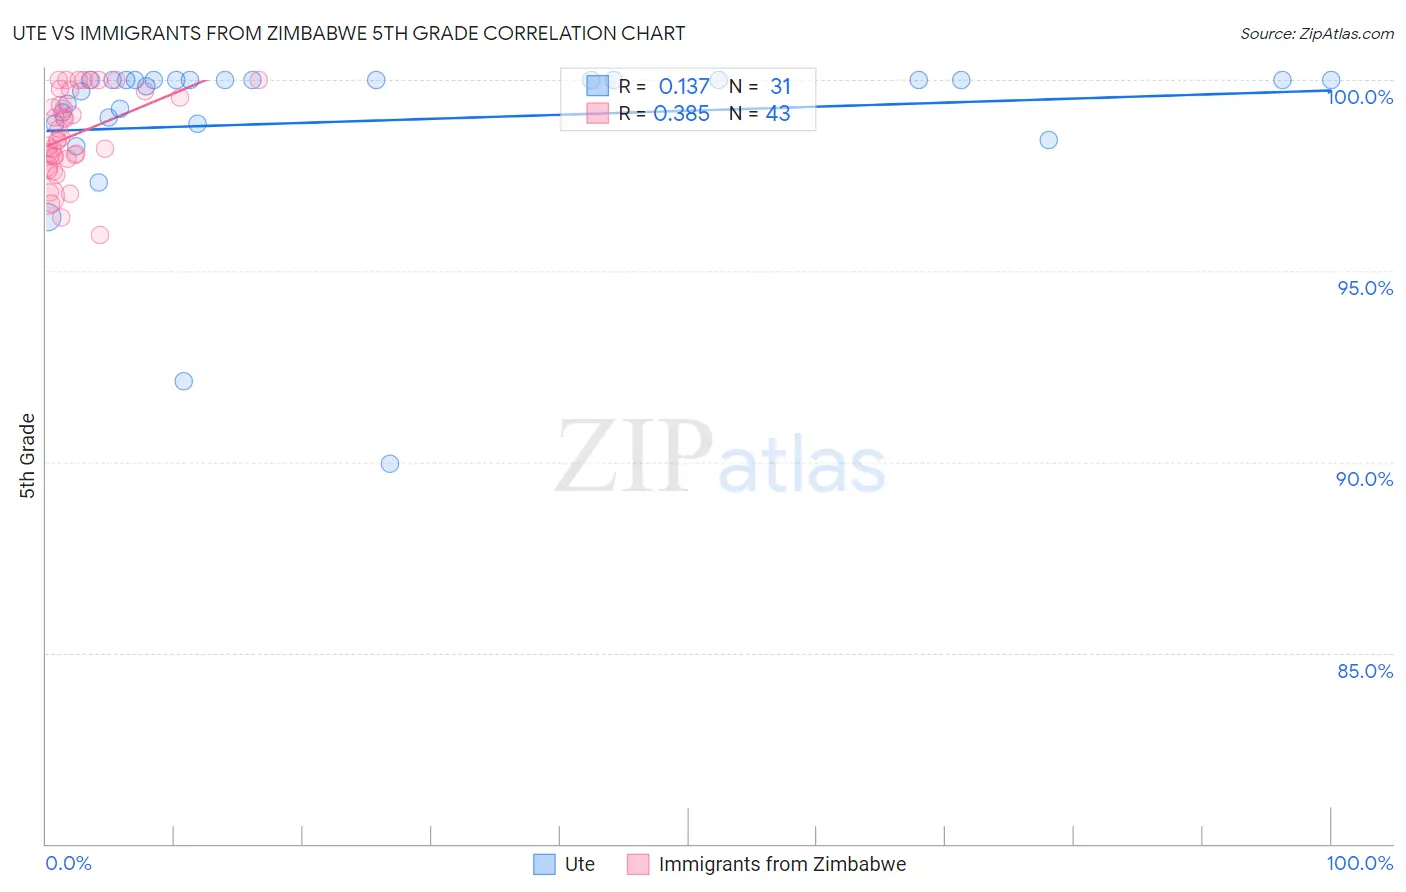
Ute vs Immigrants from Zimbabwe 5th Grade Correlation Chart
The statistical analysis conducted on geographies consisting of 55,668,539 people shows a poor positive correlation between the proportion of Ute and percentage of population with at least 5th grade education in the United States with a correlation coefficient (R) of 0.137 and weighted average of 97.4%. Similarly, the statistical analysis conducted on geographies consisting of 117,756,150 people shows a mild positive correlation between the proportion of Immigrants from Zimbabwe and percentage of population with at least 5th grade education in the United States with a correlation coefficient (R) of 0.385 and weighted average of 97.6%, a difference of 0.19%.
5th Grade Correlation Summary
| Measurement | Ute | Immigrants from Zimbabwe |
| Minimum | 89.9% | 95.9% |
| Maximum | 100.0% | 100.0% |
| Range | 10.1% | 4.1% |
| Mean | 98.9% | 98.6% |
| Median | 100.0% | 98.4% |
| Interquartile 25% (IQ1) | 98.9% | 98.0% |
| Interquartile 75% (IQ3) | 100.0% | 99.7% |
| Interquartile Range (IQR) | 1.1% | 1.7% |
| Standard Deviation (Sample) | 2.3% | 1.1% |
| Standard Deviation (Population) | 2.3% | 1.1% |
Similar Demographics by 5th Grade
Demographics Similar to Ute by 5th Grade
In terms of 5th grade, the demographic groups most similar to Ute are Immigrants from Eastern Europe (97.4%, a difference of 0.0%), Alsatian (97.4%, a difference of 0.0%), Immigrants from Israel (97.5%, a difference of 0.020%), Hopi (97.5%, a difference of 0.020%), and Immigrants from South Central Asia (97.5%, a difference of 0.020%).
| Demographics | Rating | Rank | 5th Grade |
| Jordanians | 82.6 /100 | #145 | Excellent 97.5% |
| Spaniards | 81.9 /100 | #146 | Excellent 97.5% |
| Soviet Union | 81.2 /100 | #147 | Excellent 97.5% |
| Immigrants | Israel | 79.1 /100 | #148 | Good 97.5% |
| Hopi | 78.6 /100 | #149 | Good 97.5% |
| Immigrants | South Central Asia | 78.6 /100 | #150 | Good 97.5% |
| Immigrants | Eastern Europe | 75.0 /100 | #151 | Good 97.4% |
| Ute | 74.9 /100 | #152 | Good 97.4% |
| Alsatians | 74.3 /100 | #153 | Good 97.4% |
| Immigrants | Russia | 71.2 /100 | #154 | Good 97.4% |
| Immigrants | Bosnia and Herzegovina | 71.0 /100 | #155 | Good 97.4% |
| French American Indians | 70.5 /100 | #156 | Good 97.4% |
| Immigrants | Jordan | 70.4 /100 | #157 | Good 97.4% |
| Albanians | 68.3 /100 | #158 | Good 97.4% |
| Immigrants | Italy | 65.2 /100 | #159 | Good 97.4% |
Demographics Similar to Immigrants from Zimbabwe by 5th Grade
In terms of 5th grade, the demographic groups most similar to Immigrants from Zimbabwe are Syrian (97.6%, a difference of 0.0%), Immigrants from France (97.6%, a difference of 0.0%), Immigrants from Japan (97.6%, a difference of 0.0%), Immigrants from Saudi Arabia (97.6%, a difference of 0.010%), and Basque (97.6%, a difference of 0.010%).
| Demographics | Rating | Rank | 5th Grade |
| Iroquois | 95.9 /100 | #113 | Exceptional 97.7% |
| Lebanese | 95.7 /100 | #114 | Exceptional 97.6% |
| Okinawans | 95.7 /100 | #115 | Exceptional 97.6% |
| Immigrants | Croatia | 95.5 /100 | #116 | Exceptional 97.6% |
| Immigrants | Saudi Arabia | 95.4 /100 | #117 | Exceptional 97.6% |
| Basques | 95.2 /100 | #118 | Exceptional 97.6% |
| Syrians | 95.1 /100 | #119 | Exceptional 97.6% |
| Immigrants | Zimbabwe | 94.9 /100 | #120 | Exceptional 97.6% |
| Immigrants | France | 94.8 /100 | #121 | Exceptional 97.6% |
| Immigrants | Japan | 94.7 /100 | #122 | Exceptional 97.6% |
| Immigrants | Norway | 94.6 /100 | #123 | Exceptional 97.6% |
| Spanish | 93.7 /100 | #124 | Exceptional 97.6% |
| Immigrants | Bulgaria | 93.1 /100 | #125 | Exceptional 97.6% |
| Hmong | 92.3 /100 | #126 | Exceptional 97.6% |
| Immigrants | Serbia | 92.3 /100 | #127 | Exceptional 97.6% |