Peruvian vs Immigrants from Guyana 5th Grade
COMPARE
Peruvian
Immigrants from Guyana
5th Grade
5th Grade Comparison
Peruvians
Immigrants from Guyana
96.8%
5TH GRADE
0.6/ 100
METRIC RATING
257th/ 347
METRIC RANK
96.0%
5TH GRADE
0.0/ 100
METRIC RATING
309th/ 347
METRIC RANK
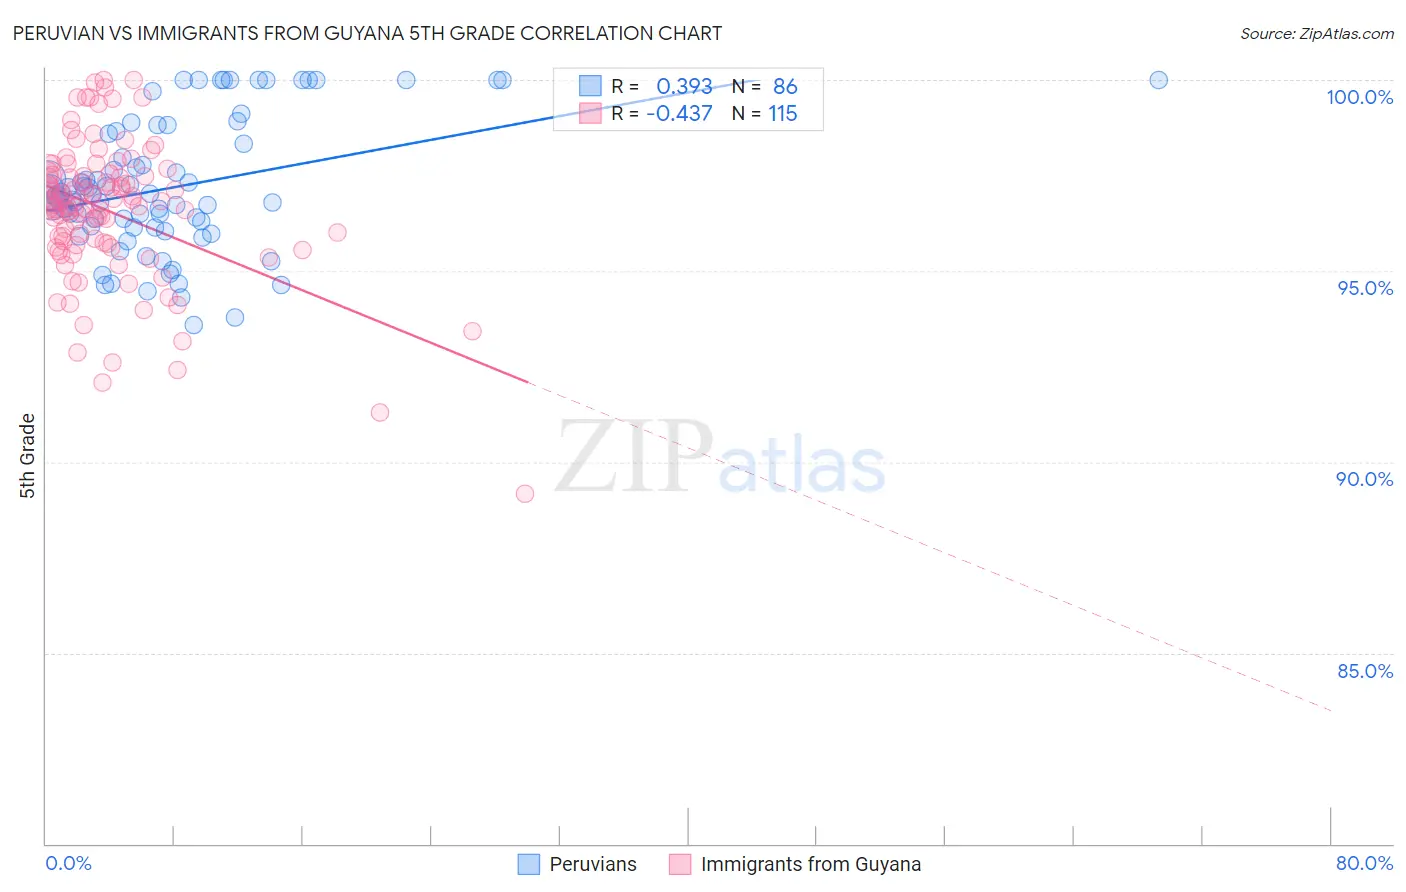
Peruvian vs Immigrants from Guyana 5th Grade Correlation Chart
The statistical analysis conducted on geographies consisting of 363,068,462 people shows a mild positive correlation between the proportion of Peruvians and percentage of population with at least 5th grade education in the United States with a correlation coefficient (R) of 0.393 and weighted average of 96.8%. Similarly, the statistical analysis conducted on geographies consisting of 183,673,461 people shows a moderate negative correlation between the proportion of Immigrants from Guyana and percentage of population with at least 5th grade education in the United States with a correlation coefficient (R) of -0.437 and weighted average of 96.0%, a difference of 0.83%.
5th Grade Correlation Summary
| Measurement | Peruvian | Immigrants from Guyana |
| Minimum | 93.6% | 89.2% |
| Maximum | 100.0% | 100.0% |
| Range | 6.4% | 10.8% |
| Mean | 97.2% | 96.6% |
| Median | 96.9% | 96.7% |
| Interquartile 25% (IQ1) | 96.2% | 95.7% |
| Interquartile 75% (IQ3) | 98.6% | 97.5% |
| Interquartile Range (IQR) | 2.4% | 1.9% |
| Standard Deviation (Sample) | 1.7% | 1.9% |
| Standard Deviation (Population) | 1.7% | 1.9% |
Similar Demographics by 5th Grade
Demographics Similar to Peruvians by 5th Grade
In terms of 5th grade, the demographic groups most similar to Peruvians are Immigrants from Congo (96.8%, a difference of 0.0%), South American (96.8%, a difference of 0.010%), Immigrants from Middle Africa (96.8%, a difference of 0.030%), Immigrants from Senegal (96.8%, a difference of 0.030%), and Immigrants from Ethiopia (96.8%, a difference of 0.030%).
| Demographics | Rating | Rank | 5th Grade |
| Immigrants | Liberia | 1.0 /100 | #250 | Tragic 96.9% |
| Bolivians | 0.9 /100 | #251 | Tragic 96.9% |
| Jamaicans | 0.9 /100 | #252 | Tragic 96.9% |
| Immigrants | Middle Africa | 0.8 /100 | #253 | Tragic 96.8% |
| Immigrants | Senegal | 0.8 /100 | #254 | Tragic 96.8% |
| South Americans | 0.7 /100 | #255 | Tragic 96.8% |
| Immigrants | Congo | 0.7 /100 | #256 | Tragic 96.8% |
| Peruvians | 0.6 /100 | #257 | Tragic 96.8% |
| Immigrants | Ethiopia | 0.5 /100 | #258 | Tragic 96.8% |
| Immigrants | China | 0.5 /100 | #259 | Tragic 96.8% |
| Immigrants | Jamaica | 0.4 /100 | #260 | Tragic 96.8% |
| Immigrants | Sierra Leone | 0.4 /100 | #261 | Tragic 96.8% |
| Immigrants | Colombia | 0.4 /100 | #262 | Tragic 96.8% |
| Immigrants | Uzbekistan | 0.3 /100 | #263 | Tragic 96.8% |
| West Indians | 0.3 /100 | #264 | Tragic 96.8% |
Demographics Similar to Immigrants from Guyana by 5th Grade
In terms of 5th grade, the demographic groups most similar to Immigrants from Guyana are Ecuadorian (96.0%, a difference of 0.010%), Immigrants from Haiti (96.0%, a difference of 0.020%), Immigrants from Caribbean (96.0%, a difference of 0.020%), Immigrants from Laos (96.0%, a difference of 0.030%), and Indonesian (96.0%, a difference of 0.040%).
| Demographics | Rating | Rank | 5th Grade |
| Guyanese | 0.0 /100 | #302 | Tragic 96.1% |
| Puerto Ricans | 0.0 /100 | #303 | Tragic 96.1% |
| Immigrants | Burma/Myanmar | 0.0 /100 | #304 | Tragic 96.1% |
| Immigrants | Laos | 0.0 /100 | #305 | Tragic 96.0% |
| Immigrants | Haiti | 0.0 /100 | #306 | Tragic 96.0% |
| Immigrants | Caribbean | 0.0 /100 | #307 | Tragic 96.0% |
| Ecuadorians | 0.0 /100 | #308 | Tragic 96.0% |
| Immigrants | Guyana | 0.0 /100 | #309 | Tragic 96.0% |
| Indonesians | 0.0 /100 | #310 | Tragic 96.0% |
| Immigrants | Bangladesh | 0.0 /100 | #311 | Tragic 96.0% |
| Vietnamese | 0.0 /100 | #312 | Tragic 95.9% |
| Bangladeshis | 0.0 /100 | #313 | Tragic 95.9% |
| Immigrants | Portugal | 0.0 /100 | #314 | Tragic 95.9% |
| Nicaraguans | 0.0 /100 | #315 | Tragic 95.9% |
| Immigrants | Ecuador | 0.0 /100 | #316 | Tragic 95.8% |