Pennsylvania German vs Vietnamese Professional Degree
COMPARE
Pennsylvania German
Vietnamese
Professional Degree
Professional Degree Comparison
Pennsylvania Germans
Vietnamese
3.0%
PROFESSIONAL DEGREE
0.0/ 100
METRIC RATING
334th/ 347
METRIC RANK
4.5%
PROFESSIONAL DEGREE
68.4/ 100
METRIC RATING
159th/ 347
METRIC RANK
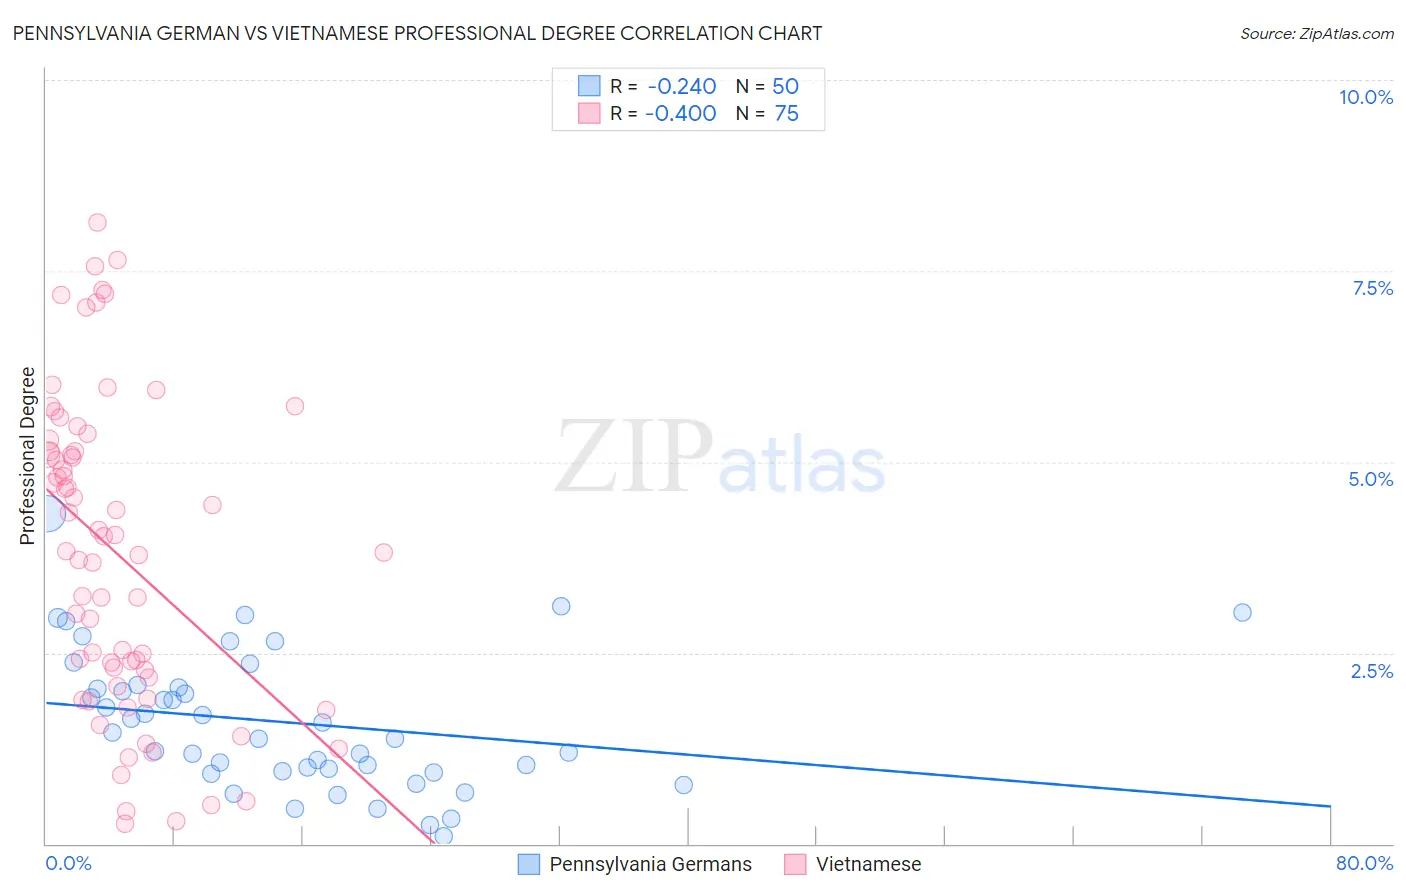
Pennsylvania German vs Vietnamese Professional Degree Correlation Chart
The statistical analysis conducted on geographies consisting of 233,026,471 people shows a weak negative correlation between the proportion of Pennsylvania Germans and percentage of population with at least professional degree education in the United States with a correlation coefficient (R) of -0.240 and weighted average of 3.0%. Similarly, the statistical analysis conducted on geographies consisting of 170,674,020 people shows a moderate negative correlation between the proportion of Vietnamese and percentage of population with at least professional degree education in the United States with a correlation coefficient (R) of -0.400 and weighted average of 4.5%, a difference of 52.4%.
Professional Degree Correlation Summary
| Measurement | Pennsylvania German | Vietnamese |
| Minimum | 0.10% | 0.26% |
| Maximum | 4.3% | 8.1% |
| Range | 4.2% | 7.9% |
| Mean | 1.6% | 3.8% |
| Median | 1.4% | 3.8% |
| Interquartile 25% (IQ1) | 0.94% | 2.2% |
| Interquartile 75% (IQ3) | 2.0% | 5.1% |
| Interquartile Range (IQR) | 1.1% | 3.0% |
| Standard Deviation (Sample) | 0.90% | 2.0% |
| Standard Deviation (Population) | 0.89% | 2.0% |
Similar Demographics by Professional Degree
Demographics Similar to Pennsylvania Germans by Professional Degree
In terms of professional degree, the demographic groups most similar to Pennsylvania Germans are Native/Alaskan (3.0%, a difference of 0.56%), Fijian (2.9%, a difference of 1.6%), Arapaho (2.9%, a difference of 3.4%), Navajo (2.9%, a difference of 3.5%), and Immigrants from Central America (2.9%, a difference of 3.6%).
| Demographics | Rating | Rank | Professional Degree |
| Dutch West Indians | 0.0 /100 | #327 | Tragic 3.1% |
| Creek | 0.0 /100 | #328 | Tragic 3.1% |
| Bangladeshis | 0.0 /100 | #329 | Tragic 3.1% |
| Immigrants | Cabo Verde | 0.0 /100 | #330 | Tragic 3.1% |
| Kiowa | 0.0 /100 | #331 | Tragic 3.1% |
| Yakama | 0.0 /100 | #332 | Tragic 3.1% |
| Puget Sound Salish | 0.0 /100 | #333 | Tragic 3.1% |
| Pennsylvania Germans | 0.0 /100 | #334 | Tragic 3.0% |
| Natives/Alaskans | 0.0 /100 | #335 | Tragic 3.0% |
| Fijians | 0.0 /100 | #336 | Tragic 2.9% |
| Arapaho | 0.0 /100 | #337 | Tragic 2.9% |
| Navajo | 0.0 /100 | #338 | Tragic 2.9% |
| Immigrants | Central America | 0.0 /100 | #339 | Tragic 2.9% |
| Yup'ik | 0.0 /100 | #340 | Tragic 2.9% |
| Tohono O'odham | 0.0 /100 | #341 | Tragic 2.8% |
Demographics Similar to Vietnamese by Professional Degree
In terms of professional degree, the demographic groups most similar to Vietnamese are Immigrants from Senegal (4.5%, a difference of 0.060%), Immigrants from Armenia (4.5%, a difference of 0.080%), Assyrian/Chaldean/Syriac (4.5%, a difference of 0.16%), Iraqi (4.5%, a difference of 0.24%), and Swedish (4.5%, a difference of 0.26%).
| Demographics | Rating | Rank | Professional Degree |
| Immigrants | Africa | 72.5 /100 | #152 | Good 4.6% |
| Immigrants | Uruguay | 72.5 /100 | #153 | Good 4.6% |
| Scottish | 71.8 /100 | #154 | Good 4.6% |
| Slavs | 70.8 /100 | #155 | Good 4.5% |
| Swedes | 69.9 /100 | #156 | Good 4.5% |
| Iraqis | 69.8 /100 | #157 | Good 4.5% |
| Immigrants | Armenia | 68.8 /100 | #158 | Good 4.5% |
| Vietnamese | 68.4 /100 | #159 | Good 4.5% |
| Immigrants | Senegal | 68.0 /100 | #160 | Good 4.5% |
| Assyrians/Chaldeans/Syriacs | 67.4 /100 | #161 | Good 4.5% |
| Peruvians | 65.2 /100 | #162 | Good 4.5% |
| Sierra Leoneans | 64.3 /100 | #163 | Good 4.5% |
| Swiss | 61.0 /100 | #164 | Good 4.5% |
| Costa Ricans | 59.9 /100 | #165 | Average 4.5% |
| Immigrants | Colombia | 59.4 /100 | #166 | Average 4.5% |