Immigrants from Africa vs Immigrants from Malaysia 4th Grade
COMPARE
Immigrants from Africa
Immigrants from Malaysia
4th Grade
4th Grade Comparison
Immigrants from Africa
Immigrants from Malaysia
97.1%
4TH GRADE
1.0/ 100
METRIC RATING
249th/ 347
METRIC RANK
97.2%
4TH GRADE
3.4/ 100
METRIC RATING
231st/ 347
METRIC RANK
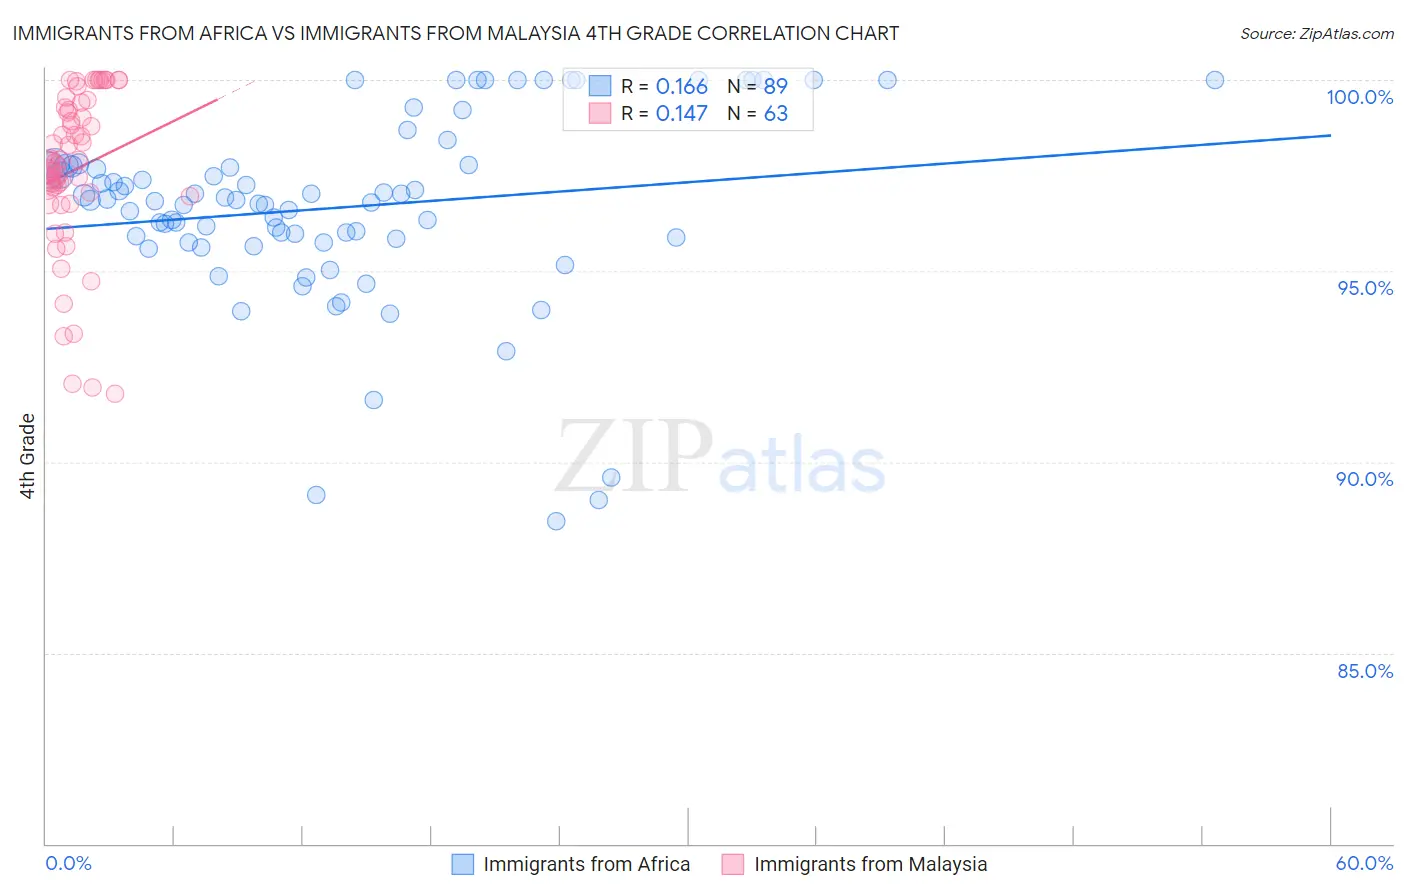
Immigrants from Africa vs Immigrants from Malaysia 4th Grade Correlation Chart
The statistical analysis conducted on geographies consisting of 469,440,174 people shows a poor positive correlation between the proportion of Immigrants from Africa and percentage of population with at least 4th grade education in the United States with a correlation coefficient (R) of 0.166 and weighted average of 97.1%. Similarly, the statistical analysis conducted on geographies consisting of 197,973,709 people shows a poor positive correlation between the proportion of Immigrants from Malaysia and percentage of population with at least 4th grade education in the United States with a correlation coefficient (R) of 0.147 and weighted average of 97.2%, a difference of 0.12%.
4th Grade Correlation Summary
| Measurement | Immigrants from Africa | Immigrants from Malaysia |
| Minimum | 88.4% | 91.8% |
| Maximum | 100.0% | 100.0% |
| Range | 11.6% | 8.2% |
| Mean | 96.7% | 97.6% |
| Median | 96.8% | 97.9% |
| Interquartile 25% (IQ1) | 95.8% | 97.0% |
| Interquartile 75% (IQ3) | 97.8% | 99.3% |
| Interquartile Range (IQR) | 2.0% | 2.3% |
| Standard Deviation (Sample) | 2.5% | 2.1% |
| Standard Deviation (Population) | 2.5% | 2.1% |
Demographics Similar to Immigrants from Africa and Immigrants from Malaysia by 4th Grade
In terms of 4th grade, the demographic groups most similar to Immigrants from Africa are Immigrants from Senegal (97.1%, a difference of 0.0%), Immigrants from Eastern Africa (97.1%, a difference of 0.020%), Immigrants from Uruguay (97.1%, a difference of 0.020%), Ethiopian (97.1%, a difference of 0.020%), and Immigrants from Asia (97.1%, a difference of 0.020%). Similarly, the demographic groups most similar to Immigrants from Malaysia are Uruguayan (97.2%, a difference of 0.0%), Immigrants from Western Asia (97.2%, a difference of 0.0%), Senegalese (97.2%, a difference of 0.010%), Assyrian/Chaldean/Syriac (97.2%, a difference of 0.010%), and Yuman (97.2%, a difference of 0.020%).
| Demographics | Rating | Rank | 4th Grade |
| Uruguayans | 3.5 /100 | #230 | Tragic 97.2% |
| Immigrants | Malaysia | 3.4 /100 | #231 | Tragic 97.2% |
| Immigrants | Western Asia | 3.4 /100 | #232 | Tragic 97.2% |
| Senegalese | 3.1 /100 | #233 | Tragic 97.2% |
| Assyrians/Chaldeans/Syriacs | 3.0 /100 | #234 | Tragic 97.2% |
| Yuman | 2.9 /100 | #235 | Tragic 97.2% |
| Immigrants | Eastern Asia | 2.7 /100 | #236 | Tragic 97.2% |
| Immigrants | Costa Rica | 2.0 /100 | #237 | Tragic 97.2% |
| Indians (Asian) | 1.9 /100 | #238 | Tragic 97.2% |
| Nigerians | 1.8 /100 | #239 | Tragic 97.1% |
| Colombians | 1.6 /100 | #240 | Tragic 97.1% |
| Immigrants | Indonesia | 1.5 /100 | #241 | Tragic 97.1% |
| Asians | 1.4 /100 | #242 | Tragic 97.1% |
| U.S. Virgin Islanders | 1.4 /100 | #243 | Tragic 97.1% |
| Koreans | 1.3 /100 | #244 | Tragic 97.1% |
| Immigrants | Eastern Africa | 1.2 /100 | #245 | Tragic 97.1% |
| Immigrants | Uruguay | 1.2 /100 | #246 | Tragic 97.1% |
| Ethiopians | 1.2 /100 | #247 | Tragic 97.1% |
| Immigrants | Asia | 1.2 /100 | #248 | Tragic 97.1% |
| Immigrants | Africa | 1.0 /100 | #249 | Tragic 97.1% |
| Immigrants | Senegal | 0.9 /100 | #250 | Tragic 97.1% |