Panamanian vs Uruguayan 3rd Grade
COMPARE
Panamanian
Uruguayan
3rd Grade
3rd Grade Comparison
Panamanians
Uruguayans
97.7%
3RD GRADE
31.5/ 100
METRIC RATING
190th/ 347
METRIC RANK
97.5%
3RD GRADE
5.0/ 100
METRIC RATING
221st/ 347
METRIC RANK
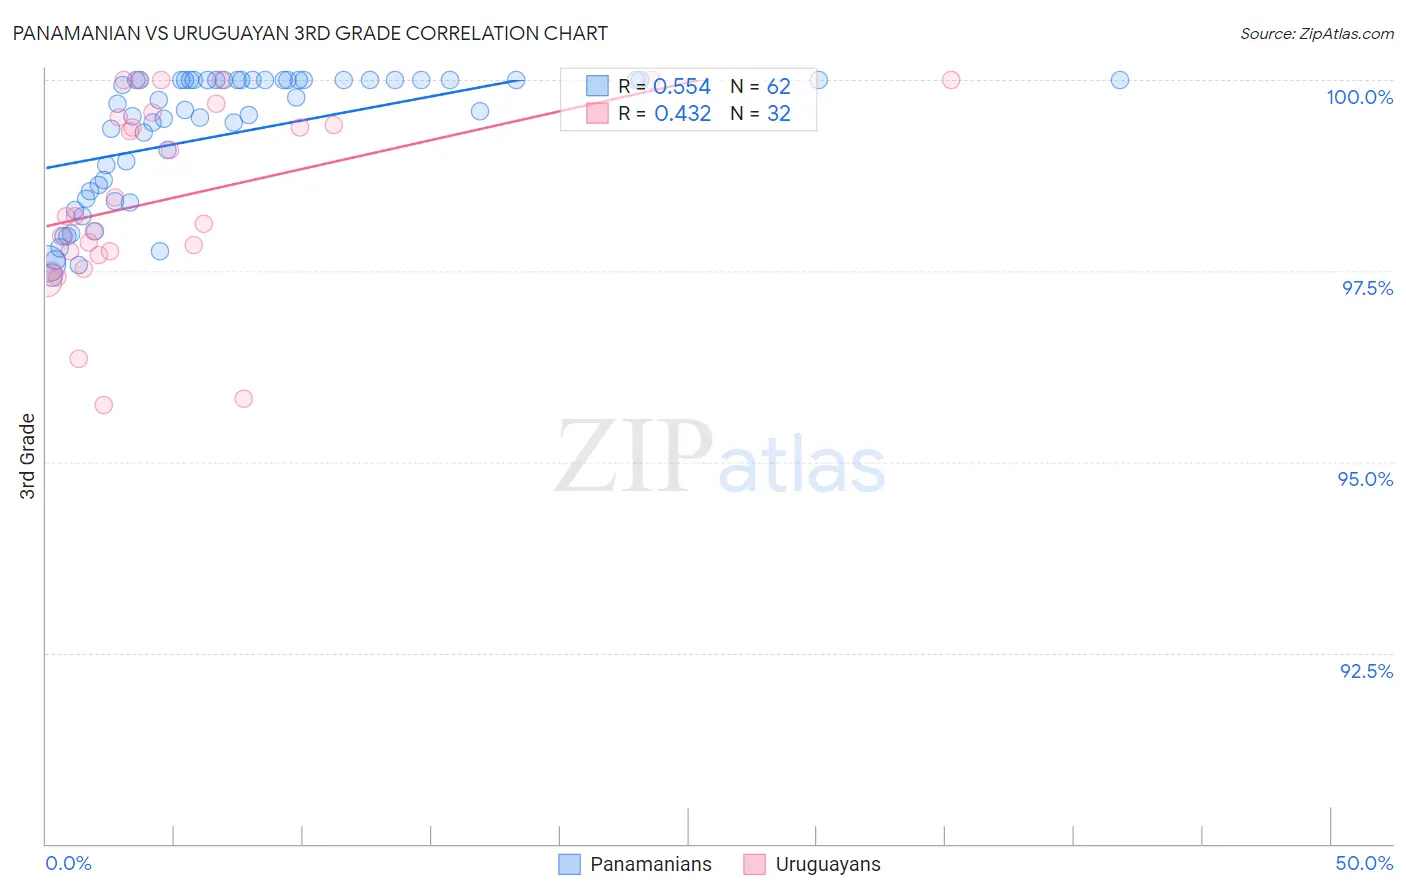
Panamanian vs Uruguayan 3rd Grade Correlation Chart
The statistical analysis conducted on geographies consisting of 281,248,945 people shows a substantial positive correlation between the proportion of Panamanians and percentage of population with at least 3rd grade education in the United States with a correlation coefficient (R) of 0.554 and weighted average of 97.7%. Similarly, the statistical analysis conducted on geographies consisting of 144,782,794 people shows a moderate positive correlation between the proportion of Uruguayans and percentage of population with at least 3rd grade education in the United States with a correlation coefficient (R) of 0.432 and weighted average of 97.5%, a difference of 0.18%.
3rd Grade Correlation Summary
| Measurement | Panamanian | Uruguayan |
| Minimum | 97.4% | 95.7% |
| Maximum | 100.0% | 100.0% |
| Range | 2.6% | 4.3% |
| Mean | 99.3% | 98.5% |
| Median | 99.6% | 98.2% |
| Interquartile 25% (IQ1) | 98.5% | 97.7% |
| Interquartile 75% (IQ3) | 100.0% | 99.5% |
| Interquartile Range (IQR) | 1.5% | 1.8% |
| Standard Deviation (Sample) | 0.85% | 1.2% |
| Standard Deviation (Population) | 0.85% | 1.2% |
Similar Demographics by 3rd Grade
Demographics Similar to Panamanians by 3rd Grade
In terms of 3rd grade, the demographic groups most similar to Panamanians are Native/Alaskan (97.7%, a difference of 0.010%), Immigrants from Taiwan (97.7%, a difference of 0.010%), Pakistani (97.7%, a difference of 0.010%), Black/African American (97.7%, a difference of 0.010%), and Mongolian (97.7%, a difference of 0.010%).
| Demographics | Rating | Rank | 3rd Grade |
| Arabs | 40.0 /100 | #183 | Fair 97.7% |
| Immigrants | Kazakhstan | 37.4 /100 | #184 | Fair 97.7% |
| Immigrants | Argentina | 37.0 /100 | #185 | Fair 97.7% |
| Portuguese | 36.2 /100 | #186 | Fair 97.7% |
| Natives/Alaskans | 35.2 /100 | #187 | Fair 97.7% |
| Immigrants | Taiwan | 34.2 /100 | #188 | Fair 97.7% |
| Pakistanis | 34.2 /100 | #189 | Fair 97.7% |
| Panamanians | 31.5 /100 | #190 | Fair 97.7% |
| Blacks/African Americans | 29.6 /100 | #191 | Fair 97.7% |
| Mongolians | 29.1 /100 | #192 | Fair 97.7% |
| Immigrants | Kenya | 28.2 /100 | #193 | Fair 97.7% |
| Immigrants | Uganda | 27.4 /100 | #194 | Fair 97.7% |
| Immigrants | Egypt | 26.8 /100 | #195 | Fair 97.7% |
| Paraguayans | 26.2 /100 | #196 | Fair 97.7% |
| Hawaiians | 25.7 /100 | #197 | Fair 97.7% |
Demographics Similar to Uruguayans by 3rd Grade
In terms of 3rd grade, the demographic groups most similar to Uruguayans are Immigrants from Panama (97.5%, a difference of 0.0%), Immigrants from Morocco (97.5%, a difference of 0.0%), South American Indian (97.5%, a difference of 0.010%), Immigrants from Nepal (97.5%, a difference of 0.010%), and Sierra Leonean (97.5%, a difference of 0.010%).
| Demographics | Rating | Rank | 3rd Grade |
| Yuman | 8.4 /100 | #214 | Tragic 97.6% |
| Iraqis | 6.9 /100 | #215 | Tragic 97.5% |
| Samoans | 6.9 /100 | #216 | Tragic 97.5% |
| South American Indians | 5.7 /100 | #217 | Tragic 97.5% |
| Immigrants | Nepal | 5.3 /100 | #218 | Tragic 97.5% |
| Immigrants | Panama | 5.2 /100 | #219 | Tragic 97.5% |
| Immigrants | Morocco | 5.0 /100 | #220 | Tragic 97.5% |
| Uruguayans | 5.0 /100 | #221 | Tragic 97.5% |
| Sierra Leoneans | 4.6 /100 | #222 | Tragic 97.5% |
| Immigrants | Syria | 4.4 /100 | #223 | Tragic 97.5% |
| Bahamians | 4.4 /100 | #224 | Tragic 97.5% |
| Tongans | 4.3 /100 | #225 | Tragic 97.5% |
| Sudanese | 4.1 /100 | #226 | Tragic 97.5% |
| Immigrants | Sudan | 3.4 /100 | #227 | Tragic 97.5% |
| Sub-Saharan Africans | 3.2 /100 | #228 | Tragic 97.5% |