Panamanian vs Uruguayan In Labor Force | Age 25-29

COMPARE

Panamanian
Race
Ancestry
AfghanAfricanAlaska NativeAlaskan AthabascanAlbanianAleutAlsatianAmericanApacheArabArapahoArgentineanArmenianAssyrian/Chaldean/SyriacAustralianAustrianBahamianBangladeshiBarbadianBasqueBelgianBelizeanBermudanBhutaneseBlackfeetBolivianBrazilianBritishBritish West IndianBulgarianBurmeseCajunCambodianCanadianCape VerdeanCarpatho RusynCelticCentral AmericanCentral American IndianCherokeeCheyenneChickasawChileanChineseChippewaChoctawColombianColvilleComancheCosta RicanCreeCreekCroatianCrowCubanCypriotCzechCzechoslovakianDanishDelawareDominicanDutchDutch West IndianEastern EuropeanEcuadorianEgyptianEnglishEstonianEthiopianEuropeanFijianFilipinoFinnishFrenchFrench American IndianFrench CanadianGermanGerman RussianGhanaianGreekGuamanian/ChamorroGuatemalanGuyaneseHaitianHmongHonduranHopiHoumaHungarianIcelanderIndian (Asian)IndonesianInupiatIranianIraqiIrishIroquoisIsraeliItalianJamaicanJapaneseJordanianKenyanKiowaKoreanLaotianLatvianLebaneseLiberianLithuanianLumbeeLuxembourgerMacedonianMalaysianMalteseMarshalleseMenomineeMexicanMexican American IndianMongolianMoroccanNative HawaiianNavajoNepaleseNew ZealanderNicaraguanNigerianNorthern EuropeanNorwegianOkinawanOsageOttawaPaiutePakistaniPalestinianPanamanianParaguayanPennsylvania GermanPeruvianPimaPolishPortuguesePotawatomiPuebloPuerto RicanPuget Sound SalishRomanianRussianSalvadoranSamoanScandinavianScotch-IrishScottishSeminoleSenegaleseSerbianShoshoneSierra LeoneanSiouxSlavicSlovakSloveneSomaliSouth AfricanSouth AmericanSouth American IndianSoviet UnionSpaniardSpanishSpanish AmericanSpanish American IndianSri LankanSubsaharan AfricanSudaneseSwedishSwissSyrianTaiwaneseThaiTlingit-HaidaTohono O'OdhamTonganTrinidadian and TobagonianTsimshianTurkishU.S. Virgin IslanderUgandanUkrainianUteVenezuelanVietnameseWelshWest IndianYakamaYaquiYugoslavianYumanYup'ikZimbabwean
Immigration
NonimmigrantsImmigrantsAfghanistanAfricaAlbaniaArgentinaArmeniaAsiaAustraliaAustriaBahamasBangladeshBarbadosBelarusBelgiumBelizeBoliviaBosnia and HerzegovinaBrazilBulgariaBurma/MyanmarCabo VerdeCambodiaCameroonCanadaCaribbeanCentral AmericaChileChinaColombiaCongoCosta RicaCroatiaCubaCzechoslovakiaDenmarkDominicaDominican RepublicEastern AfricaEastern AsiaEastern EuropeEcuadorEgyptEl SalvadorEnglandEritreaEthiopiaEuropeFijiFranceGermanyGhanaGreeceGrenadaGuatemalaGuyanaHaitiHondurasHong KongHungaryIndiaIndonesiaIranIraqIrelandIsraelItalyJamaicaJapanJordanKazakhstanKenyaKoreaKuwaitLaosLatin AmericaLatviaLebanonLiberiaLithuaniaMalaysiaMexicoMicronesiaMiddle AfricaMoldovaMoroccoNepalNetherlandsNicaraguaNigeriaNorth AmericaNorth MacedoniaNorthern AfricaNorthern EuropeNorwayOceaniaPakistanPanamaPeruPhilippinesPolandPortugalRomaniaRussiaSaudi ArabiaScotlandSenegalSerbiaSierra LeoneSingaporeSomaliaSouth AfricaSouth AmericaSouth Central AsiaSouth Eastern AsiaSouthern EuropeSpainSri LankaSt. Vincent and the GrenadinesSudanSwedenSwitzerlandSyriaTaiwanThailandTrinidad and TobagoTurkeyUgandaUkraineUruguayUzbekistanVenezuelaVietnamWest IndiesWestern AfricaWestern AsiaWestern EuropeYemenZaireZimbabweAzores
Uruguayan
Race
Ancestry
AfghanAfricanAlaska NativeAlaskan AthabascanAlbanianAleutAlsatianAmericanApacheArabArapahoArgentineanArmenianAssyrian/Chaldean/SyriacAustralianAustrianBahamianBangladeshiBarbadianBasqueBelgianBelizeanBermudanBhutaneseBlackfeetBolivianBrazilianBritishBritish West IndianBulgarianBurmeseCajunCambodianCanadianCape VerdeanCarpatho RusynCelticCentral AmericanCentral American IndianCherokeeCheyenneChickasawChileanChineseChippewaChoctawColombianColvilleComancheCosta RicanCreeCreekCroatianCrowCubanCypriotCzechCzechoslovakianDanishDelawareDominicanDutchDutch West IndianEastern EuropeanEcuadorianEgyptianEnglishEstonianEthiopianEuropeanFijianFilipinoFinnishFrenchFrench American IndianFrench CanadianGermanGerman RussianGhanaianGreekGuamanian/ChamorroGuatemalanGuyaneseHaitianHmongHonduranHopiHoumaHungarianIcelanderIndian (Asian)IndonesianInupiatIranianIraqiIrishIroquoisIsraeliItalianJamaicanJapaneseJordanianKenyanKiowaKoreanLaotianLatvianLebaneseLiberianLithuanianLumbeeLuxembourgerMacedonianMalaysianMalteseMarshalleseMenomineeMexicanMexican American IndianMongolianMoroccanNative HawaiianNavajoNepaleseNew ZealanderNicaraguanNigerianNorthern EuropeanNorwegianOkinawanOsageOttawaPaiutePakistaniPalestinianParaguayanPennsylvania GermanPeruvianPimaPolishPortuguesePotawatomiPuebloPuerto RicanPuget Sound SalishRomanianRussianSalvadoranSamoanScandinavianScotch-IrishScottishSeminoleSenegaleseSerbianShoshoneSierra LeoneanSiouxSlavicSlovakSloveneSomaliSouth AfricanSouth AmericanSouth American IndianSoviet UnionSpaniardSpanishSpanish AmericanSpanish American IndianSri LankanSubsaharan AfricanSudaneseSwedishSwissSyrianTaiwaneseThaiTlingit-HaidaTohono O'OdhamTonganTrinidadian and TobagonianTsimshianTurkishU.S. Virgin IslanderUgandanUkrainianUruguayanUteVenezuelanVietnameseWelshWest IndianYakamaYaquiYugoslavianYumanYup'ikZimbabwean
Immigration
NonimmigrantsImmigrantsAfghanistanAfricaAlbaniaArgentinaArmeniaAsiaAustraliaAustriaBahamasBangladeshBarbadosBelarusBelgiumBelizeBoliviaBosnia and HerzegovinaBrazilBulgariaBurma/MyanmarCabo VerdeCambodiaCameroonCanadaCaribbeanCentral AmericaChileChinaColombiaCongoCosta RicaCroatiaCubaCzechoslovakiaDenmarkDominicaDominican RepublicEastern AfricaEastern AsiaEastern EuropeEcuadorEgyptEl SalvadorEnglandEritreaEthiopiaEuropeFijiFranceGermanyGhanaGreeceGrenadaGuatemalaGuyanaHaitiHondurasHong KongHungaryIndiaIndonesiaIranIraqIrelandIsraelItalyJamaicaJapanJordanKazakhstanKenyaKoreaKuwaitLaosLatin AmericaLatviaLebanonLiberiaLithuaniaMalaysiaMexicoMicronesiaMiddle AfricaMoldovaMoroccoNepalNetherlandsNicaraguaNigeriaNorth AmericaNorth MacedoniaNorthern AfricaNorthern EuropeNorwayOceaniaPakistanPanamaPeruPhilippinesPolandPortugalRomaniaRussiaSaudi ArabiaScotlandSenegalSerbiaSierra LeoneSingaporeSomaliaSouth AfricaSouth AmericaSouth Central AsiaSouth Eastern AsiaSouthern EuropeSpainSri LankaSt. Vincent and the GrenadinesSudanSwedenSwitzerlandSyriaTaiwanThailandTrinidad and TobagoTurkeyUgandaUkraineUruguayUzbekistanVenezuelaVietnamWest IndiesWestern AfricaWestern AsiaWestern EuropeYemenZaireZimbabweAzores
In Labor Force | Age 25-29
Income
Poverty
Unemployment
Labor Participation
Family Structure
Vehicle Availability
Education Level
Disability

In Labor Force | Age 25-29 Comparison

Panamanians

Uruguayans

Tragic
Excellent
84.2%
IN LABOR FORCE | AGE 25-29
4.5/ 100
METRIC RATING
232nd/ 347
METRIC RANK
84.9%
IN LABOR FORCE | AGE 25-29
84.7/ 100
METRIC RATING
125th/ 347
METRIC RANK

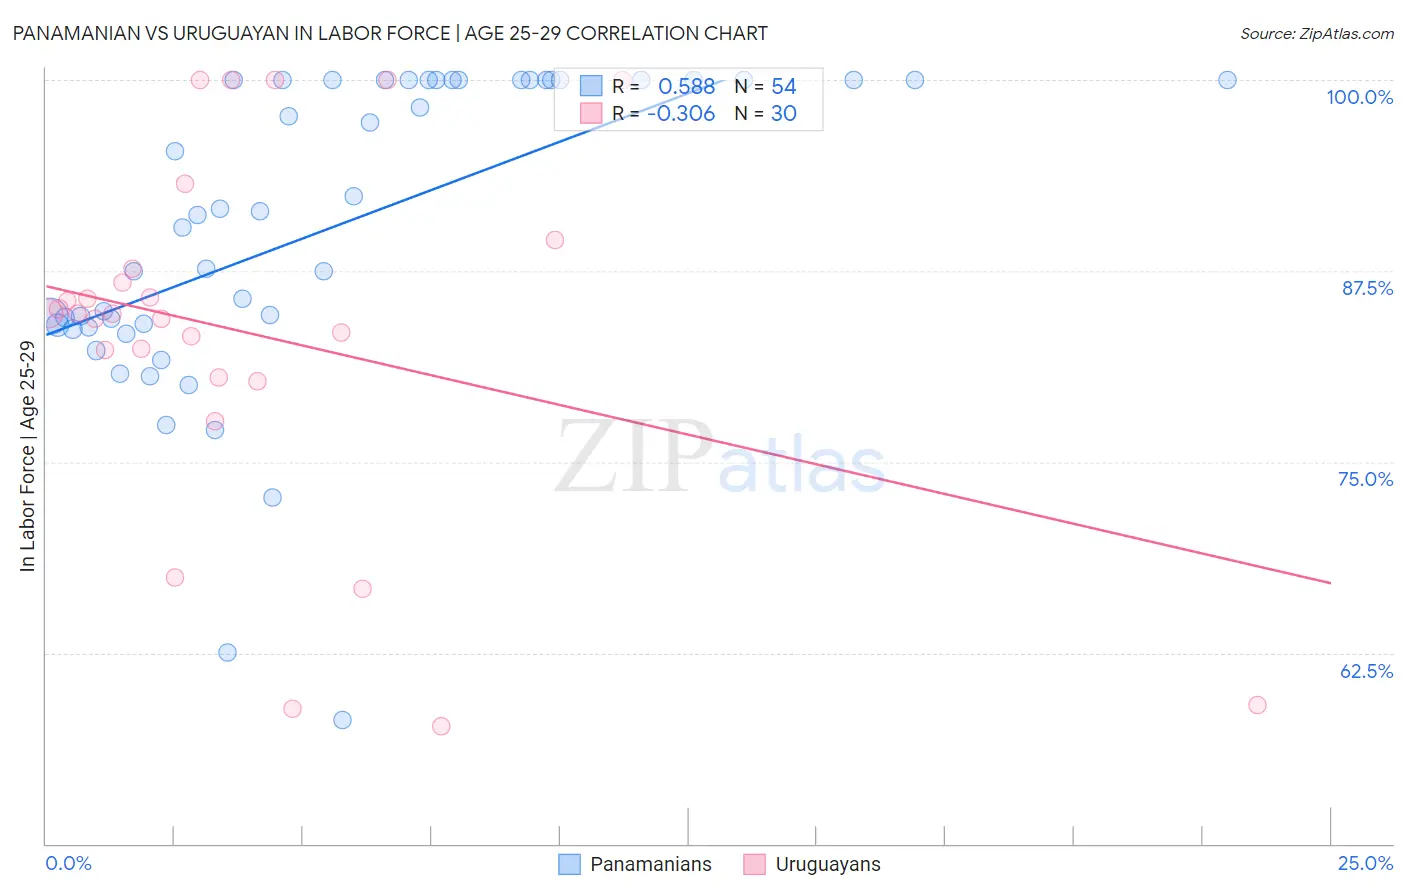
Panamanian vs Uruguayan In Labor Force | Age 25-29 Correlation Chart

The statistical analysis conducted on geographies consisting of 281,182,728 people shows a substantial positive correlation between the proportion of Panamanians and labor force participation rate among population between the ages 25 and 29 in the United States with a correlation coefficient (R) of 0.588 and weighted average of 84.2%. Similarly, the statistical analysis conducted on geographies consisting of 144,778,510 people shows a mild negative correlation between the proportion of Uruguayans and labor force participation rate among population between the ages 25 and 29 in the United States with a correlation coefficient (R) of -0.306 and weighted average of 84.9%, a difference of 0.88%.
Panamanian vs Uruguayan In Labor Force | Age 25-29

In Labor Force | Age 25-29 Correlation Summary

MeasurementPanamanianUruguayan
Minimum58.1%57.7%
Maximum100.0%100.0%
Range41.9%42.3%
Mean90.2%83.4%
Median91.3%84.7%
Interquartile 25% (IQ1)83.9%80.5%
Interquartile 75% (IQ3)100.0%87.6%
Interquartile Range (IQR)16.1%7.1%
Standard Deviation (Sample)10.1%11.8%
Standard Deviation (Population)10.0%11.6%

Similar Demographics by In Labor Force | Age 25-29

Demographics Similar to Panamanians by In Labor Force | Age 25-29

In terms of in labor force | age 25-29, the demographic groups most similar to Panamanians are White/Caucasian (84.2%, a difference of 0.010%), Immigrants from Philippines (84.2%, a difference of 0.010%), Immigrants from Oceania (84.2%, a difference of 0.020%), French American Indian (84.2%, a difference of 0.040%), and Immigrants from Panama (84.2%, a difference of 0.040%).
DemographicsRating | RankIn Labor Force | Age 25-29
Koreans
5.9
/100
|
#225
Tragic
84.2%
Immigrants | Congo
5.8
/100
|
#226
Tragic
84.2%
French American Indians
5.5
/100
|
#227
Tragic
84.2%
Immigrants | Panama
5.5
/100
|
#228
Tragic
84.2%
Immigrants | Oceania
5.0
/100
|
#229
Tragic
84.2%
Whites/Caucasians
4.8
/100
|
#230
Tragic
84.2%
Immigrants | Philippines
4.7
/100
|
#231
Tragic
84.2%
Panamanians
4.5
/100
|
#232
Tragic
84.2%
Immigrants | Western Asia
2.7
/100
|
#233
Tragic
84.1%
Barbadians
1.0
/100
|
#234
Tragic
83.9%
Iraqis
0.9
/100
|
#235
Tragic
83.9%
Guamanians/Chamorros
0.9
/100
|
#236
Tragic
83.9%
Immigrants | Immigrants
0.9
/100
|
#237
Tragic
83.9%
Immigrants | Uzbekistan
0.8
/100
|
#238
Tragic
83.9%
Jamaicans
0.8
/100
|
#239
Tragic
83.9%

Demographics Similar to Uruguayans by In Labor Force | Age 25-29

In terms of in labor force | age 25-29, the demographic groups most similar to Uruguayans are Dutch (84.9%, a difference of 0.0%), Immigrants from Iran (84.9%, a difference of 0.0%), Immigrants from Singapore (84.9%, a difference of 0.0%), Immigrants from Chile (84.9%, a difference of 0.010%), and Scandinavian (84.9%, a difference of 0.010%).
DemographicsRating | RankIn Labor Force | Age 25-29
Finns
87.8
/100
|
#118
Excellent
85.0%
Filipinos
87.1
/100
|
#119
Excellent
84.9%
Immigrants | South Africa
86.1
/100
|
#120
Excellent
84.9%
Immigrants | Chile
85.6
/100
|
#121
Excellent
84.9%
Scandinavians
85.1
/100
|
#122
Excellent
84.9%
Dutch
84.9
/100
|
#123
Excellent
84.9%
Immigrants | Iran
84.8
/100
|
#124
Excellent
84.9%
Uruguayans
84.7
/100
|
#125
Excellent
84.9%
Immigrants | Singapore
84.4
/100
|
#126
Excellent
84.9%
Immigrants | Uruguay
84.0
/100
|
#127
Excellent
84.9%
Australians
83.6
/100
|
#128
Excellent
84.9%
Immigrants | Russia
81.6
/100
|
#129
Excellent
84.9%
Northern Europeans
81.3
/100
|
#130
Excellent
84.9%
Iranians
78.1
/100
|
#131
Good
84.8%
Romanians
77.7
/100
|
#132
Good
84.8%