Panamanian vs Thai Unemployment Among Women with Children Under 18 years
COMPARE
Panamanian
Thai
Unemployment Among Women with Children Under 18 years
Unemployment Among Women with Children Under 18 years Comparison
Panamanians
Thais
5.7%
UNEMPLOYMENT AMONG WOMEN WITH CHILDREN UNDER 18 YEARS
10.1/ 100
METRIC RATING
211th/ 347
METRIC RANK
4.8%
UNEMPLOYMENT AMONG WOMEN WITH CHILDREN UNDER 18 YEARS
99.8/ 100
METRIC RATING
15th/ 347
METRIC RANK
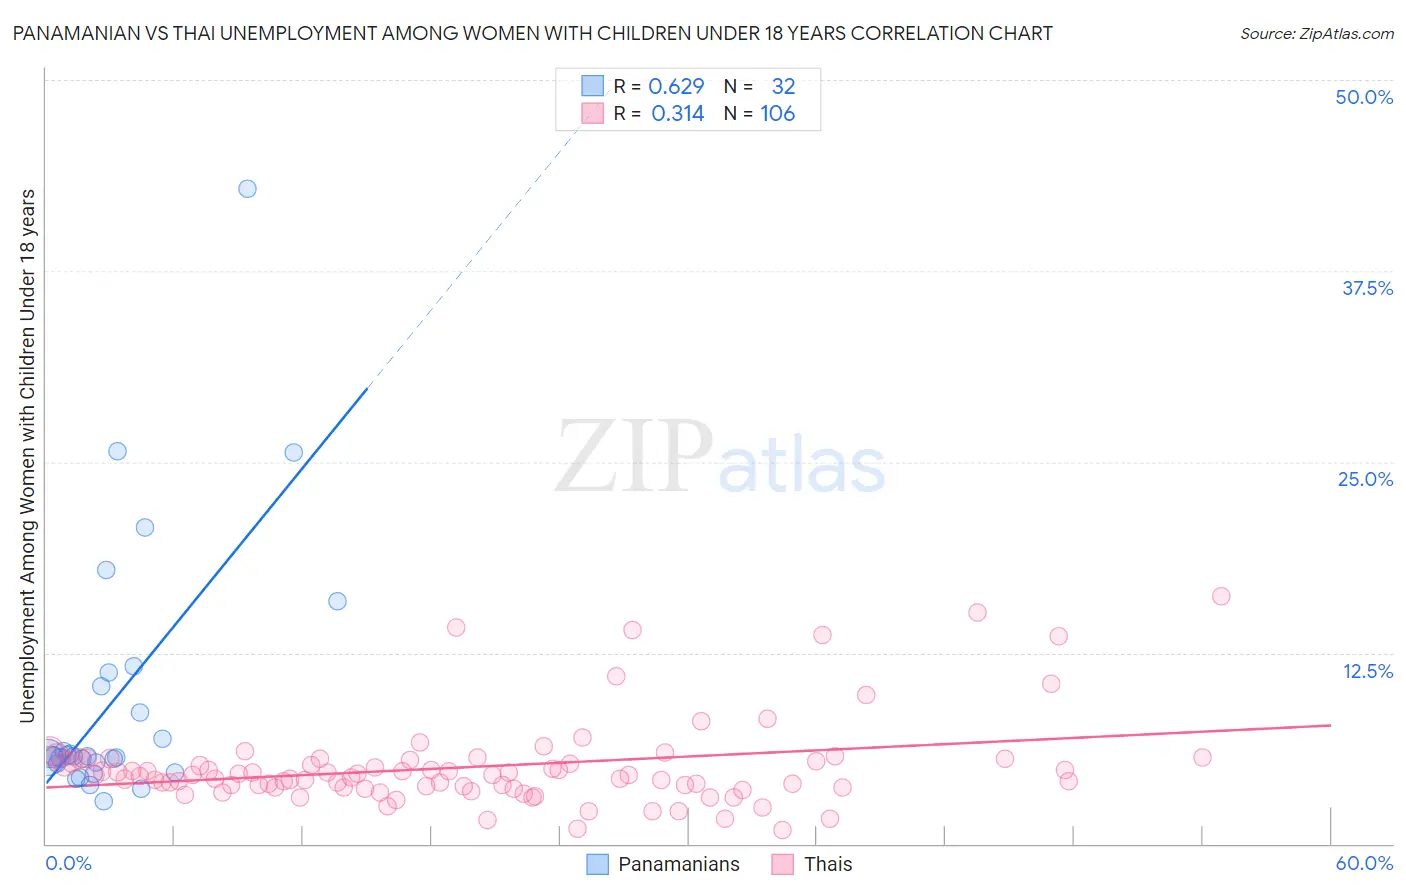
Panamanian vs Thai Unemployment Among Women with Children Under 18 years Correlation Chart
The statistical analysis conducted on geographies consisting of 275,323,843 people shows a significant positive correlation between the proportion of Panamanians and unemployment rate among women with children under the age of 18 in the United States with a correlation coefficient (R) of 0.629 and weighted average of 5.7%. Similarly, the statistical analysis conducted on geographies consisting of 452,734,115 people shows a mild positive correlation between the proportion of Thais and unemployment rate among women with children under the age of 18 in the United States with a correlation coefficient (R) of 0.314 and weighted average of 4.8%, a difference of 17.3%.
Unemployment Among Women with Children Under 18 years Correlation Summary
| Measurement | Panamanian | Thai |
| Minimum | 2.8% | 0.90% |
| Maximum | 42.9% | 16.2% |
| Range | 40.1% | 15.3% |
| Mean | 9.5% | 5.0% |
| Median | 5.7% | 4.5% |
| Interquartile 25% (IQ1) | 5.3% | 3.7% |
| Interquartile 75% (IQ3) | 10.7% | 5.5% |
| Interquartile Range (IQR) | 5.5% | 1.8% |
| Standard Deviation (Sample) | 8.6% | 2.8% |
| Standard Deviation (Population) | 8.5% | 2.8% |
Similar Demographics by Unemployment Among Women with Children Under 18 years
Demographics Similar to Panamanians by Unemployment Among Women with Children Under 18 years
In terms of unemployment among women with children under 18 years, the demographic groups most similar to Panamanians are South American (5.7%, a difference of 0.010%), Nonimmigrants (5.7%, a difference of 0.11%), Immigrants from Western Asia (5.6%, a difference of 0.22%), American (5.7%, a difference of 0.23%), and Japanese (5.7%, a difference of 0.26%).
| Demographics | Rating | Rank | Unemployment Among Women with Children Under 18 years |
| Israelis | 15.6 /100 | #204 | Poor 5.6% |
| Tsimshian | 15.2 /100 | #205 | Poor 5.6% |
| Nicaraguans | 12.3 /100 | #206 | Poor 5.6% |
| Peruvians | 12.1 /100 | #207 | Poor 5.6% |
| Immigrants | Costa Rica | 11.6 /100 | #208 | Poor 5.6% |
| Immigrants | Western Asia | 11.3 /100 | #209 | Poor 5.6% |
| Immigrants | Nonimmigrants | 10.6 /100 | #210 | Poor 5.7% |
| Panamanians | 10.1 /100 | #211 | Poor 5.7% |
| South Americans | 10.0 /100 | #212 | Poor 5.7% |
| Americans | 8.9 /100 | #213 | Tragic 5.7% |
| Japanese | 8.7 /100 | #214 | Tragic 5.7% |
| Immigrants | Uganda | 7.9 /100 | #215 | Tragic 5.7% |
| Immigrants | Peru | 7.4 /100 | #216 | Tragic 5.7% |
| Immigrants | Brazil | 7.1 /100 | #217 | Tragic 5.7% |
| Immigrants | Nicaragua | 7.0 /100 | #218 | Tragic 5.7% |
Demographics Similar to Thais by Unemployment Among Women with Children Under 18 years
In terms of unemployment among women with children under 18 years, the demographic groups most similar to Thais are Cambodian (4.8%, a difference of 0.16%), Taiwanese (4.8%, a difference of 0.46%), Bulgarian (4.8%, a difference of 0.51%), Immigrants from Singapore (4.9%, a difference of 0.66%), and Slovene (4.9%, a difference of 0.77%).
| Demographics | Rating | Rank | Unemployment Among Women with Children Under 18 years |
| Immigrants | Hong Kong | 100.0 /100 | #8 | Exceptional 4.7% |
| Okinawans | 99.9 /100 | #9 | Exceptional 4.7% |
| Czechs | 99.9 /100 | #10 | Exceptional 4.7% |
| Filipinos | 99.9 /100 | #11 | Exceptional 4.8% |
| Scandinavians | 99.9 /100 | #12 | Exceptional 4.8% |
| Bulgarians | 99.9 /100 | #13 | Exceptional 4.8% |
| Cambodians | 99.9 /100 | #14 | Exceptional 4.8% |
| Thais | 99.8 /100 | #15 | Exceptional 4.8% |
| Taiwanese | 99.8 /100 | #16 | Exceptional 4.8% |
| Immigrants | Singapore | 99.8 /100 | #17 | Exceptional 4.9% |
| Slovenes | 99.8 /100 | #18 | Exceptional 4.9% |
| Germans | 99.8 /100 | #19 | Exceptional 4.9% |
| Latvians | 99.7 /100 | #20 | Exceptional 4.9% |
| Europeans | 99.6 /100 | #21 | Exceptional 4.9% |
| Indians (Asian) | 99.6 /100 | #22 | Exceptional 4.9% |