Panamanian vs Immigrants from Lithuania 1st Grade
COMPARE
Panamanian
Immigrants from Lithuania
1st Grade
1st Grade Comparison
Panamanians
Immigrants from Lithuania
97.9%
1ST GRADE
34.1/ 100
METRIC RATING
190th/ 347
METRIC RANK
98.3%
1ST GRADE
99.2/ 100
METRIC RATING
79th/ 347
METRIC RANK
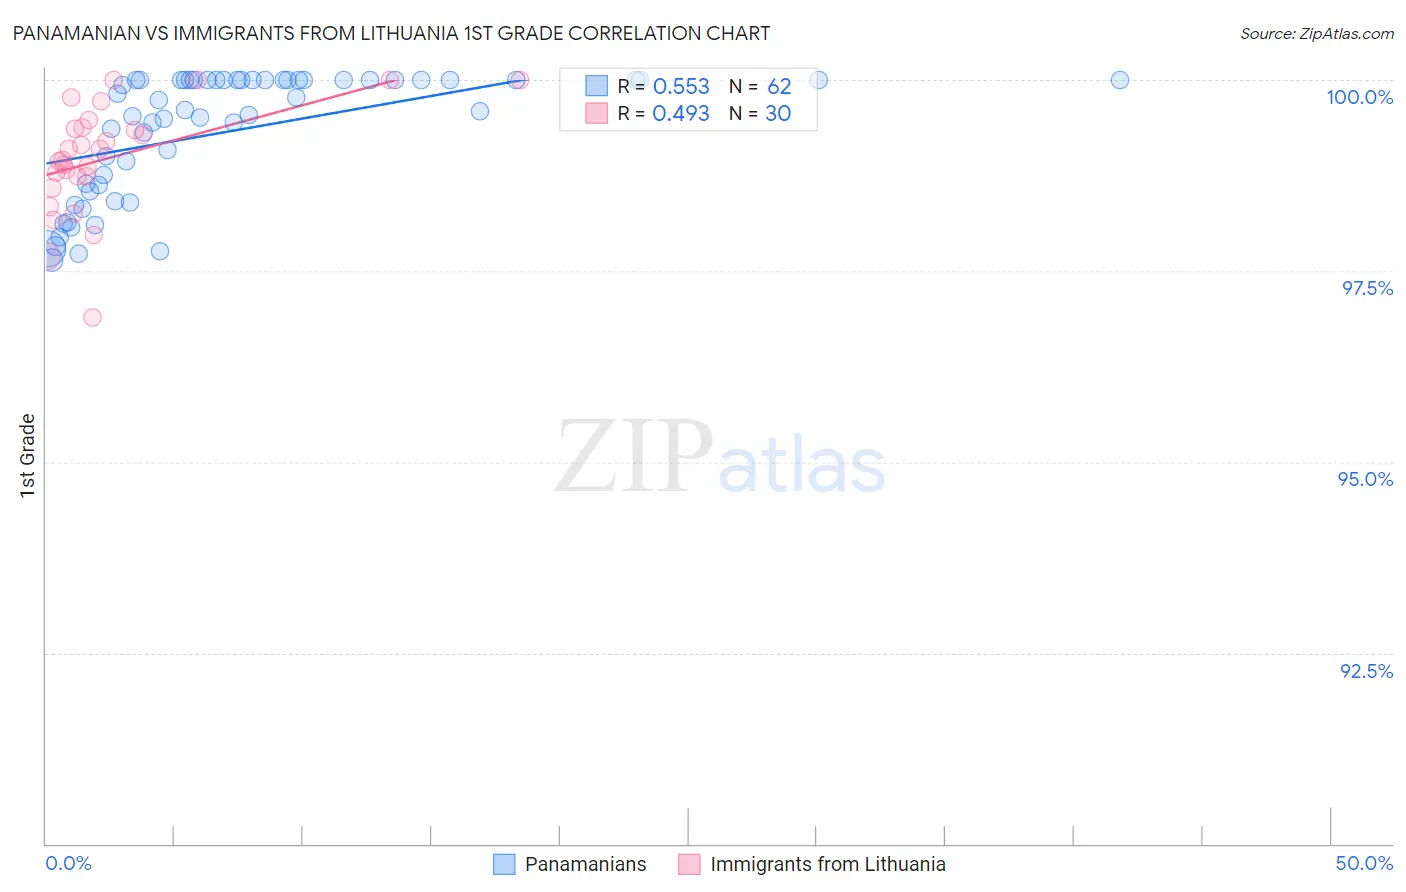
Panamanian vs Immigrants from Lithuania 1st Grade Correlation Chart
The statistical analysis conducted on geographies consisting of 281,248,945 people shows a substantial positive correlation between the proportion of Panamanians and percentage of population with at least 1st grade education in the United States with a correlation coefficient (R) of 0.553 and weighted average of 97.9%. Similarly, the statistical analysis conducted on geographies consisting of 117,724,932 people shows a moderate positive correlation between the proportion of Immigrants from Lithuania and percentage of population with at least 1st grade education in the United States with a correlation coefficient (R) of 0.493 and weighted average of 98.3%, a difference of 0.42%.
1st Grade Correlation Summary
| Measurement | Panamanian | Immigrants from Lithuania |
| Minimum | 97.6% | 96.9% |
| Maximum | 100.0% | 100.0% |
| Range | 2.4% | 3.1% |
| Mean | 99.3% | 99.0% |
| Median | 99.7% | 99.0% |
| Interquartile 25% (IQ1) | 98.6% | 98.7% |
| Interquartile 75% (IQ3) | 100.0% | 99.4% |
| Interquartile Range (IQR) | 1.4% | 0.64% |
| Standard Deviation (Sample) | 0.81% | 0.72% |
| Standard Deviation (Population) | 0.80% | 0.71% |
Similar Demographics by 1st Grade
Demographics Similar to Panamanians by 1st Grade
In terms of 1st grade, the demographic groups most similar to Panamanians are Arab (97.9%, a difference of 0.0%), Immigrants from Kazakhstan (97.9%, a difference of 0.0%), Paiute (97.9%, a difference of 0.010%), Pakistani (97.9%, a difference of 0.010%), and Black/African American (97.9%, a difference of 0.010%).
| Demographics | Rating | Rank | 1st Grade |
| Immigrants | Argentina | 41.3 /100 | #183 | Average 97.9% |
| Immigrants | Poland | 40.1 /100 | #184 | Average 97.9% |
| Immigrants | Belarus | 39.3 /100 | #185 | Fair 97.9% |
| Paiute | 36.5 /100 | #186 | Fair 97.9% |
| Pakistanis | 35.8 /100 | #187 | Fair 97.9% |
| Arabs | 35.5 /100 | #188 | Fair 97.9% |
| Immigrants | Kazakhstan | 34.9 /100 | #189 | Fair 97.9% |
| Panamanians | 34.1 /100 | #190 | Fair 97.9% |
| Blacks/African Americans | 30.7 /100 | #191 | Fair 97.9% |
| Paraguayans | 30.2 /100 | #192 | Fair 97.9% |
| Immigrants | Taiwan | 29.4 /100 | #193 | Fair 97.9% |
| Mongolians | 29.2 /100 | #194 | Fair 97.9% |
| Hawaiians | 28.8 /100 | #195 | Fair 97.9% |
| Immigrants | Kenya | 26.3 /100 | #196 | Fair 97.8% |
| Guamanians/Chamorros | 26.2 /100 | #197 | Fair 97.8% |
Demographics Similar to Immigrants from Lithuania by 1st Grade
In terms of 1st grade, the demographic groups most similar to Immigrants from Lithuania are Osage (98.3%, a difference of 0.0%), Potawatomi (98.3%, a difference of 0.0%), Icelander (98.3%, a difference of 0.0%), Shoshone (98.3%, a difference of 0.010%), and Immigrants from England (98.3%, a difference of 0.010%).
| Demographics | Rating | Rank | 1st Grade |
| Cheyenne | 99.6 /100 | #72 | Exceptional 98.3% |
| Cajuns | 99.5 /100 | #73 | Exceptional 98.3% |
| Immigrants | Netherlands | 99.4 /100 | #74 | Exceptional 98.3% |
| Cherokee | 99.3 /100 | #75 | Exceptional 98.3% |
| Shoshone | 99.3 /100 | #76 | Exceptional 98.3% |
| Immigrants | England | 99.3 /100 | #77 | Exceptional 98.3% |
| Immigrants | Belgium | 99.2 /100 | #78 | Exceptional 98.3% |
| Immigrants | Lithuania | 99.2 /100 | #79 | Exceptional 98.3% |
| Osage | 99.2 /100 | #80 | Exceptional 98.3% |
| Potawatomi | 99.1 /100 | #81 | Exceptional 98.3% |
| Icelanders | 99.1 /100 | #82 | Exceptional 98.3% |
| Immigrants | Sweden | 99.1 /100 | #83 | Exceptional 98.3% |
| Delaware | 99.1 /100 | #84 | Exceptional 98.3% |
| Hopi | 99.0 /100 | #85 | Exceptional 98.3% |
| Immigrants | Denmark | 99.0 /100 | #86 | Exceptional 98.3% |