Panamanian vs Northern European 1st Grade
COMPARE
Panamanian
Northern European
1st Grade
1st Grade Comparison
Panamanians
Northern Europeans
97.9%
1ST GRADE
34.1/ 100
METRIC RATING
190th/ 347
METRIC RANK
98.5%
1ST GRADE
99.9/ 100
METRIC RATING
44th/ 347
METRIC RANK
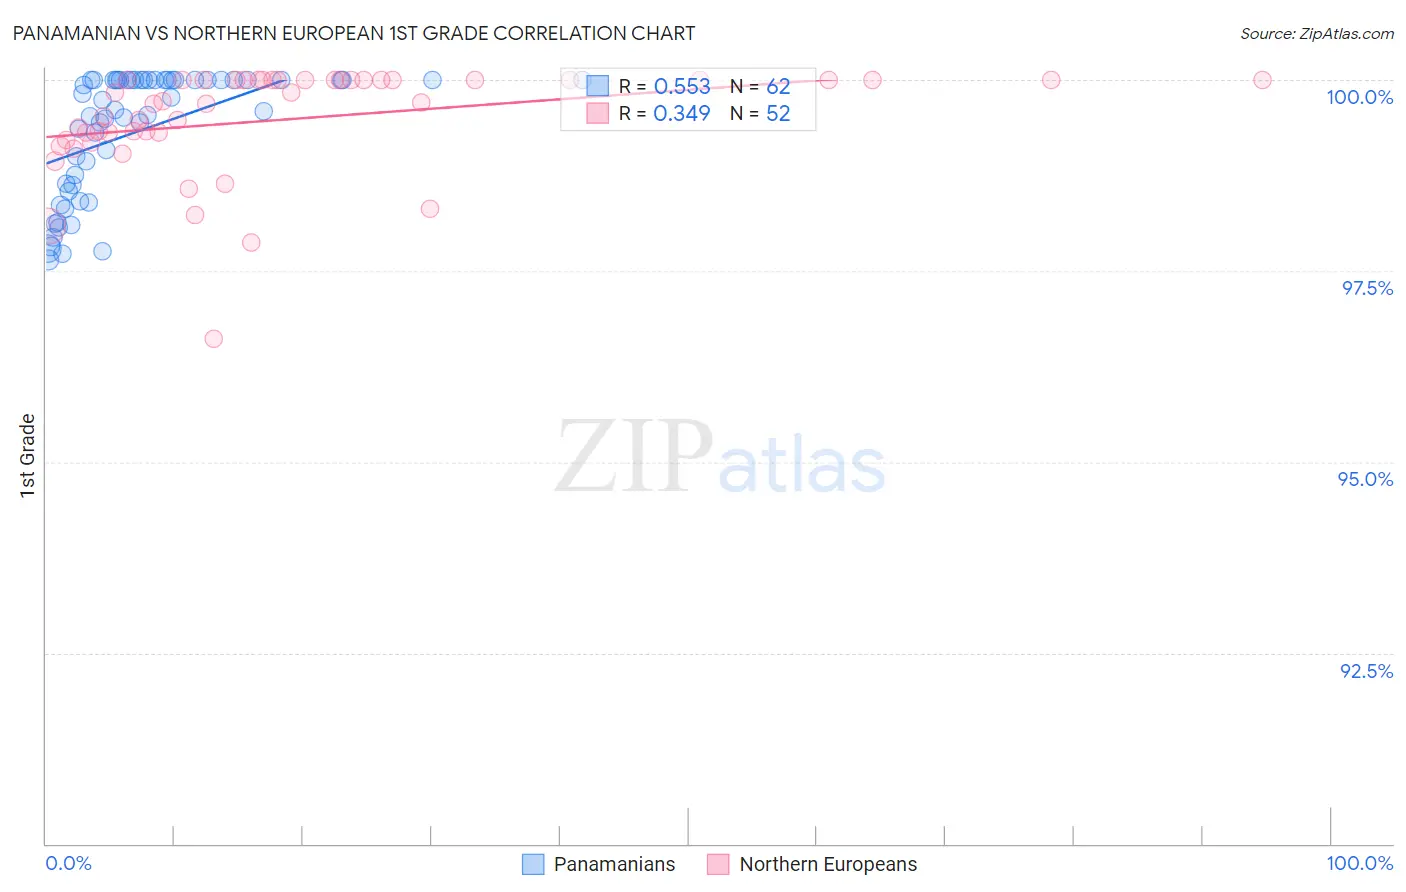
Panamanian vs Northern European 1st Grade Correlation Chart
The statistical analysis conducted on geographies consisting of 281,248,945 people shows a substantial positive correlation between the proportion of Panamanians and percentage of population with at least 1st grade education in the United States with a correlation coefficient (R) of 0.553 and weighted average of 97.9%. Similarly, the statistical analysis conducted on geographies consisting of 406,093,361 people shows a mild positive correlation between the proportion of Northern Europeans and percentage of population with at least 1st grade education in the United States with a correlation coefficient (R) of 0.349 and weighted average of 98.5%, a difference of 0.59%.
1st Grade Correlation Summary
| Measurement | Panamanian | Northern European |
| Minimum | 97.6% | 96.6% |
| Maximum | 100.0% | 100.0% |
| Range | 2.4% | 3.4% |
| Mean | 99.3% | 99.5% |
| Median | 99.7% | 99.7% |
| Interquartile 25% (IQ1) | 98.6% | 99.3% |
| Interquartile 75% (IQ3) | 100.0% | 100.0% |
| Interquartile Range (IQR) | 1.4% | 0.74% |
| Standard Deviation (Sample) | 0.81% | 0.70% |
| Standard Deviation (Population) | 0.80% | 0.69% |
Similar Demographics by 1st Grade
Demographics Similar to Panamanians by 1st Grade
In terms of 1st grade, the demographic groups most similar to Panamanians are Arab (97.9%, a difference of 0.0%), Immigrants from Kazakhstan (97.9%, a difference of 0.0%), Paiute (97.9%, a difference of 0.010%), Pakistani (97.9%, a difference of 0.010%), and Black/African American (97.9%, a difference of 0.010%).
| Demographics | Rating | Rank | 1st Grade |
| Immigrants | Argentina | 41.3 /100 | #183 | Average 97.9% |
| Immigrants | Poland | 40.1 /100 | #184 | Average 97.9% |
| Immigrants | Belarus | 39.3 /100 | #185 | Fair 97.9% |
| Paiute | 36.5 /100 | #186 | Fair 97.9% |
| Pakistanis | 35.8 /100 | #187 | Fair 97.9% |
| Arabs | 35.5 /100 | #188 | Fair 97.9% |
| Immigrants | Kazakhstan | 34.9 /100 | #189 | Fair 97.9% |
| Panamanians | 34.1 /100 | #190 | Fair 97.9% |
| Blacks/African Americans | 30.7 /100 | #191 | Fair 97.9% |
| Paraguayans | 30.2 /100 | #192 | Fair 97.9% |
| Immigrants | Taiwan | 29.4 /100 | #193 | Fair 97.9% |
| Mongolians | 29.2 /100 | #194 | Fair 97.9% |
| Hawaiians | 28.8 /100 | #195 | Fair 97.9% |
| Immigrants | Kenya | 26.3 /100 | #196 | Fair 97.8% |
| Guamanians/Chamorros | 26.2 /100 | #197 | Fair 97.8% |
Demographics Similar to Northern Europeans by 1st Grade
In terms of 1st grade, the demographic groups most similar to Northern Europeans are Lumbee (98.5%, a difference of 0.0%), Belgian (98.4%, a difference of 0.0%), Luxembourger (98.5%, a difference of 0.010%), Eastern European (98.5%, a difference of 0.010%), and Native Hawaiian (98.5%, a difference of 0.010%).
| Demographics | Rating | Rank | 1st Grade |
| Italians | 99.9 /100 | #37 | Exceptional 98.5% |
| Chippewa | 99.9 /100 | #38 | Exceptional 98.5% |
| Latvians | 99.9 /100 | #39 | Exceptional 98.5% |
| Luxembourgers | 99.9 /100 | #40 | Exceptional 98.5% |
| Eastern Europeans | 99.9 /100 | #41 | Exceptional 98.5% |
| Native Hawaiians | 99.9 /100 | #42 | Exceptional 98.5% |
| Lumbee | 99.9 /100 | #43 | Exceptional 98.5% |
| Northern Europeans | 99.9 /100 | #44 | Exceptional 98.5% |
| Belgians | 99.9 /100 | #45 | Exceptional 98.4% |
| Hungarians | 99.9 /100 | #46 | Exceptional 98.4% |
| Ottawa | 99.8 /100 | #47 | Exceptional 98.4% |
| Czechoslovakians | 99.8 /100 | #48 | Exceptional 98.4% |
| Celtics | 99.8 /100 | #49 | Exceptional 98.4% |
| Whites/Caucasians | 99.8 /100 | #50 | Exceptional 98.4% |
| Estonians | 99.8 /100 | #51 | Exceptional 98.4% |