Croatian vs Immigrants from Lithuania 1st Grade
COMPARE
Croatian
Immigrants from Lithuania
1st Grade
1st Grade Comparison
Croatians
Immigrants from Lithuania
98.6%
1ST GRADE
100.0/ 100
METRIC RATING
28th/ 347
METRIC RANK
98.3%
1ST GRADE
99.2/ 100
METRIC RATING
79th/ 347
METRIC RANK
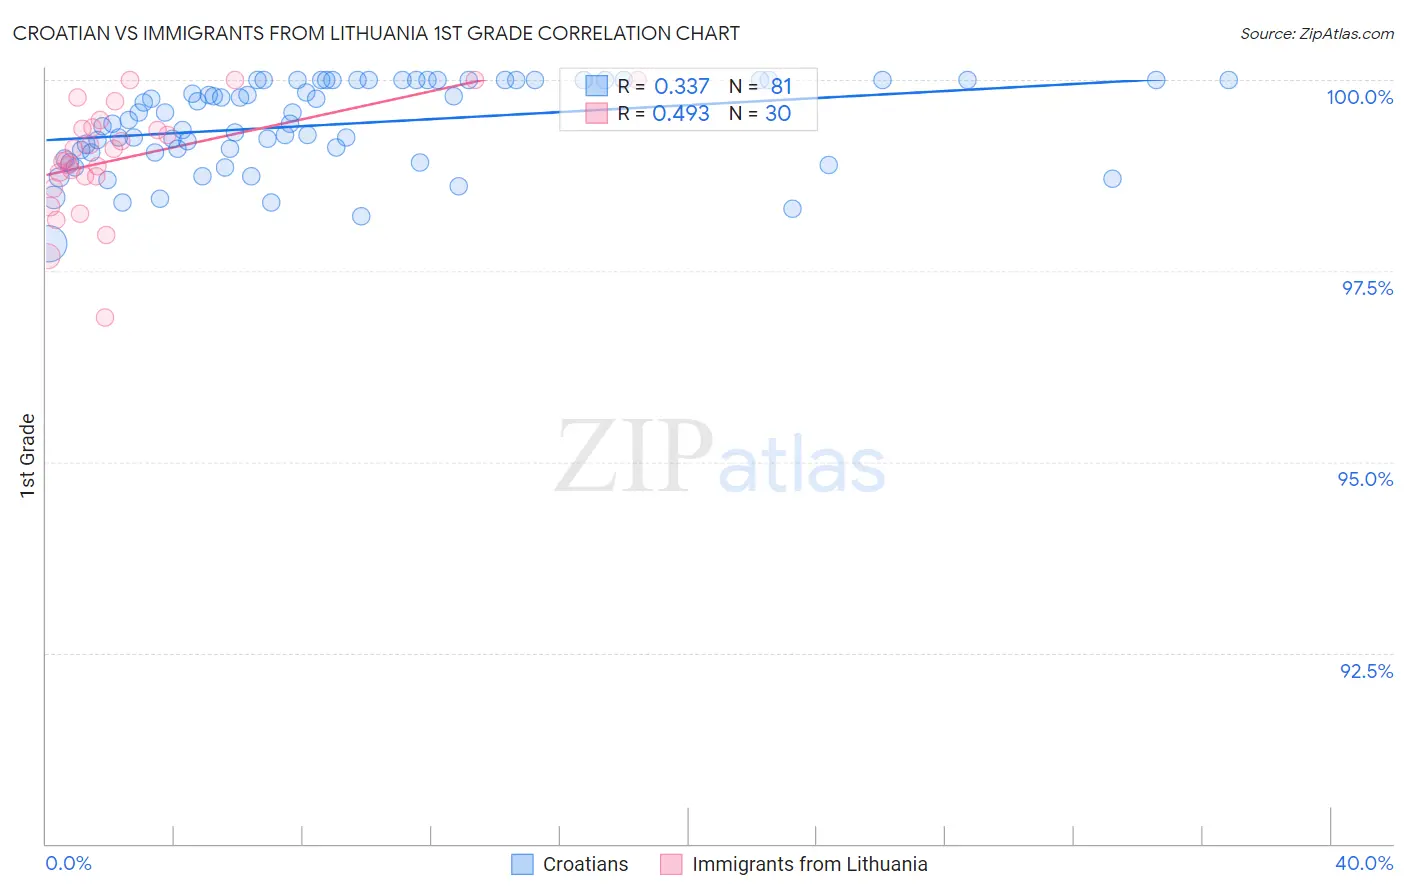
Croatian vs Immigrants from Lithuania 1st Grade Correlation Chart
The statistical analysis conducted on geographies consisting of 375,731,938 people shows a mild positive correlation between the proportion of Croatians and percentage of population with at least 1st grade education in the United States with a correlation coefficient (R) of 0.337 and weighted average of 98.6%. Similarly, the statistical analysis conducted on geographies consisting of 117,724,932 people shows a moderate positive correlation between the proportion of Immigrants from Lithuania and percentage of population with at least 1st grade education in the United States with a correlation coefficient (R) of 0.493 and weighted average of 98.3%, a difference of 0.28%.
1st Grade Correlation Summary
| Measurement | Croatian | Immigrants from Lithuania |
| Minimum | 97.9% | 96.9% |
| Maximum | 100.0% | 100.0% |
| Range | 2.1% | 3.1% |
| Mean | 99.4% | 99.0% |
| Median | 99.5% | 99.0% |
| Interquartile 25% (IQ1) | 99.1% | 98.7% |
| Interquartile 75% (IQ3) | 100.0% | 99.4% |
| Interquartile Range (IQR) | 0.95% | 0.64% |
| Standard Deviation (Sample) | 0.56% | 0.72% |
| Standard Deviation (Population) | 0.55% | 0.71% |
Similar Demographics by 1st Grade
Demographics Similar to Croatians by 1st Grade
In terms of 1st grade, the demographic groups most similar to Croatians are French (98.6%, a difference of 0.010%), European (98.5%, a difference of 0.010%), Czech (98.5%, a difference of 0.010%), Arapaho (98.6%, a difference of 0.020%), and Pennsylvania German (98.6%, a difference of 0.020%).
| Demographics | Rating | Rank | 1st Grade |
| Arapaho | 100.0 /100 | #21 | Exceptional 98.6% |
| Pennsylvania Germans | 100.0 /100 | #22 | Exceptional 98.6% |
| Finns | 100.0 /100 | #23 | Exceptional 98.6% |
| Lithuanians | 100.0 /100 | #24 | Exceptional 98.6% |
| Danes | 100.0 /100 | #25 | Exceptional 98.6% |
| Scotch-Irish | 100.0 /100 | #26 | Exceptional 98.6% |
| Poles | 100.0 /100 | #27 | Exceptional 98.6% |
| Croatians | 100.0 /100 | #28 | Exceptional 98.6% |
| French | 100.0 /100 | #29 | Exceptional 98.6% |
| Europeans | 100.0 /100 | #30 | Exceptional 98.5% |
| Czechs | 100.0 /100 | #31 | Exceptional 98.5% |
| French Canadians | 100.0 /100 | #32 | Exceptional 98.5% |
| Scandinavians | 100.0 /100 | #33 | Exceptional 98.5% |
| Swiss | 100.0 /100 | #34 | Exceptional 98.5% |
| Chinese | 100.0 /100 | #35 | Exceptional 98.5% |
Demographics Similar to Immigrants from Lithuania by 1st Grade
In terms of 1st grade, the demographic groups most similar to Immigrants from Lithuania are Osage (98.3%, a difference of 0.0%), Potawatomi (98.3%, a difference of 0.0%), Icelander (98.3%, a difference of 0.0%), Shoshone (98.3%, a difference of 0.010%), and Immigrants from England (98.3%, a difference of 0.010%).
| Demographics | Rating | Rank | 1st Grade |
| Cheyenne | 99.6 /100 | #72 | Exceptional 98.3% |
| Cajuns | 99.5 /100 | #73 | Exceptional 98.3% |
| Immigrants | Netherlands | 99.4 /100 | #74 | Exceptional 98.3% |
| Cherokee | 99.3 /100 | #75 | Exceptional 98.3% |
| Shoshone | 99.3 /100 | #76 | Exceptional 98.3% |
| Immigrants | England | 99.3 /100 | #77 | Exceptional 98.3% |
| Immigrants | Belgium | 99.2 /100 | #78 | Exceptional 98.3% |
| Immigrants | Lithuania | 99.2 /100 | #79 | Exceptional 98.3% |
| Osage | 99.2 /100 | #80 | Exceptional 98.3% |
| Potawatomi | 99.1 /100 | #81 | Exceptional 98.3% |
| Icelanders | 99.1 /100 | #82 | Exceptional 98.3% |
| Immigrants | Sweden | 99.1 /100 | #83 | Exceptional 98.3% |
| Delaware | 99.1 /100 | #84 | Exceptional 98.3% |
| Hopi | 99.0 /100 | #85 | Exceptional 98.3% |
| Immigrants | Denmark | 99.0 /100 | #86 | Exceptional 98.3% |