Panamanian vs Immigrants from Lithuania Cognitive Disability
COMPARE
Panamanian
Immigrants from Lithuania
Cognitive Disability
Cognitive Disability Comparison
Panamanians
Immigrants from Lithuania
17.8%
COGNITIVE DISABILITY
2.1/ 100
METRIC RATING
233rd/ 347
METRIC RANK
16.0%
COGNITIVE DISABILITY
100.0/ 100
METRIC RATING
4th/ 347
METRIC RANK
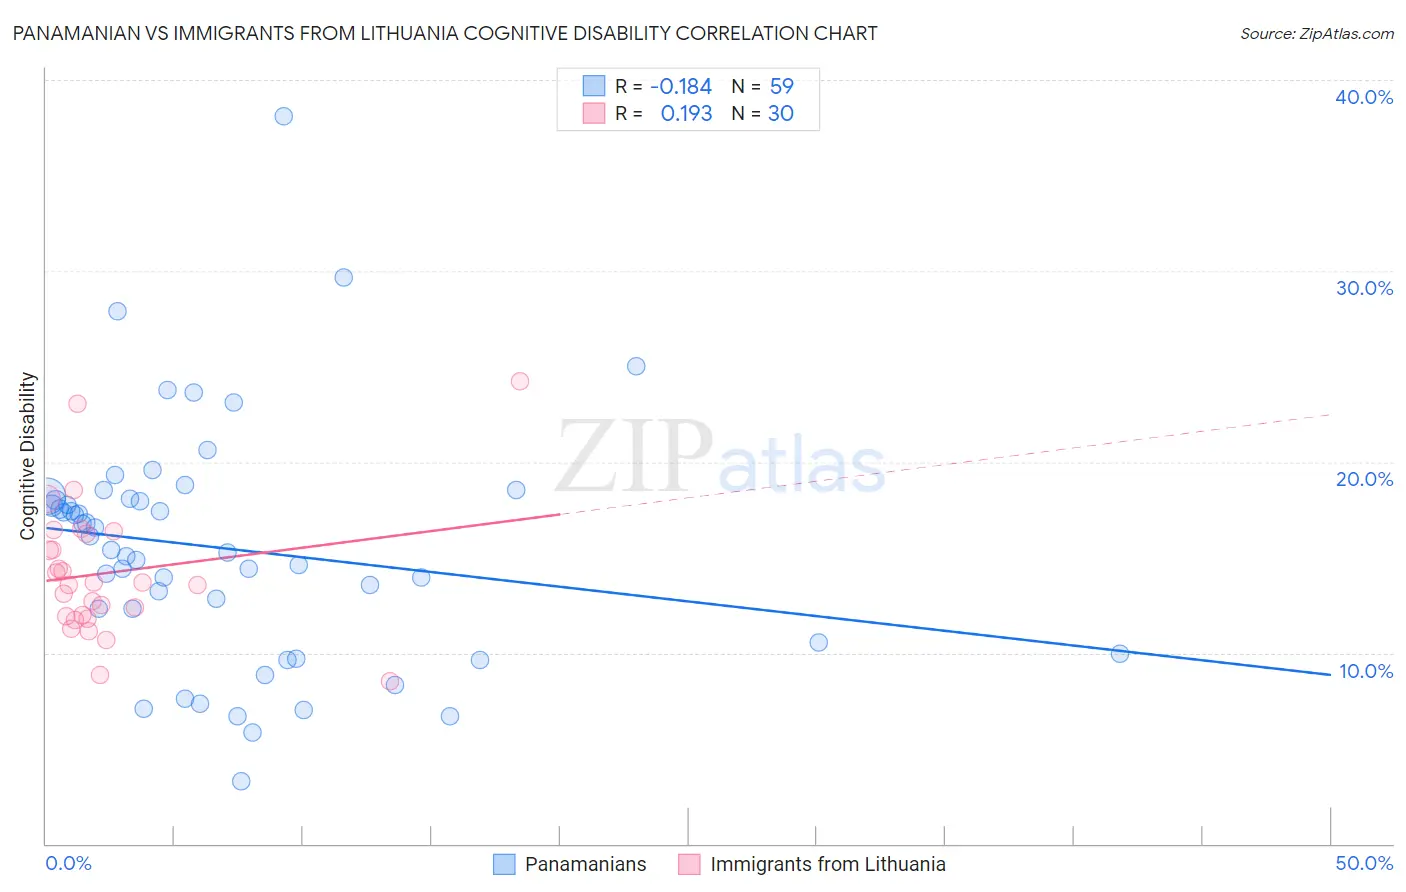
Panamanian vs Immigrants from Lithuania Cognitive Disability Correlation Chart
The statistical analysis conducted on geographies consisting of 281,192,320 people shows a poor negative correlation between the proportion of Panamanians and percentage of population with cognitive disability in the United States with a correlation coefficient (R) of -0.184 and weighted average of 17.8%. Similarly, the statistical analysis conducted on geographies consisting of 117,722,792 people shows a poor positive correlation between the proportion of Immigrants from Lithuania and percentage of population with cognitive disability in the United States with a correlation coefficient (R) of 0.193 and weighted average of 16.0%, a difference of 11.3%.
Cognitive Disability Correlation Summary
| Measurement | Panamanian | Immigrants from Lithuania |
| Minimum | 3.3% | 8.5% |
| Maximum | 38.1% | 24.2% |
| Range | 34.8% | 15.7% |
| Mean | 15.5% | 14.2% |
| Median | 15.4% | 13.6% |
| Interquartile 25% (IQ1) | 10.5% | 11.9% |
| Interquartile 75% (IQ3) | 18.1% | 16.2% |
| Interquartile Range (IQR) | 7.5% | 4.3% |
| Standard Deviation (Sample) | 6.3% | 3.5% |
| Standard Deviation (Population) | 6.2% | 3.5% |
Similar Demographics by Cognitive Disability
Demographics Similar to Panamanians by Cognitive Disability
In terms of cognitive disability, the demographic groups most similar to Panamanians are Guatemalan (17.8%, a difference of 0.0%), Tongan (17.8%, a difference of 0.0%), Osage (17.8%, a difference of 0.020%), Spanish American Indian (17.8%, a difference of 0.020%), and Mongolian (17.7%, a difference of 0.040%).
| Demographics | Rating | Rank | Cognitive Disability |
| Marshallese | 2.7 /100 | #226 | Tragic 17.7% |
| Immigrants | St. Vincent and the Grenadines | 2.6 /100 | #227 | Tragic 17.7% |
| Immigrants | Central America | 2.3 /100 | #228 | Tragic 17.7% |
| Immigrants | Guatemala | 2.2 /100 | #229 | Tragic 17.7% |
| Mongolians | 2.2 /100 | #230 | Tragic 17.7% |
| Guatemalans | 2.1 /100 | #231 | Tragic 17.8% |
| Tongans | 2.1 /100 | #232 | Tragic 17.8% |
| Panamanians | 2.1 /100 | #233 | Tragic 17.8% |
| Osage | 2.0 /100 | #234 | Tragic 17.8% |
| Spanish American Indians | 2.0 /100 | #235 | Tragic 17.8% |
| Immigrants | Iraq | 1.8 /100 | #236 | Tragic 17.8% |
| Immigrants | Mexico | 1.8 /100 | #237 | Tragic 17.8% |
| Cheyenne | 1.7 /100 | #238 | Tragic 17.8% |
| Cajuns | 1.4 /100 | #239 | Tragic 17.8% |
| Iraqis | 1.4 /100 | #240 | Tragic 17.8% |
Demographics Similar to Immigrants from Lithuania by Cognitive Disability
In terms of cognitive disability, the demographic groups most similar to Immigrants from Lithuania are Chinese (15.9%, a difference of 0.18%), Immigrants from India (15.9%, a difference of 0.27%), Immigrants from Hong Kong (16.0%, a difference of 0.41%), Thai (16.1%, a difference of 1.0%), and Immigrants from Ireland (16.1%, a difference of 1.1%).
| Demographics | Rating | Rank | Cognitive Disability |
| Immigrants | Taiwan | 100.0 /100 | #1 | Exceptional 15.7% |
| Immigrants | India | 100.0 /100 | #2 | Exceptional 15.9% |
| Chinese | 100.0 /100 | #3 | Exceptional 15.9% |
| Immigrants | Lithuania | 100.0 /100 | #4 | Exceptional 16.0% |
| Immigrants | Hong Kong | 100.0 /100 | #5 | Exceptional 16.0% |
| Thais | 100.0 /100 | #6 | Exceptional 16.1% |
| Immigrants | Ireland | 100.0 /100 | #7 | Exceptional 16.1% |
| Immigrants | Poland | 100.0 /100 | #8 | Exceptional 16.1% |
| Assyrians/Chaldeans/Syriacs | 100.0 /100 | #9 | Exceptional 16.2% |
| Immigrants | Scotland | 100.0 /100 | #10 | Exceptional 16.2% |
| Immigrants | Czechoslovakia | 100.0 /100 | #11 | Exceptional 16.2% |
| Maltese | 100.0 /100 | #12 | Exceptional 16.2% |
| Lithuanians | 100.0 /100 | #13 | Exceptional 16.3% |
| Immigrants | Austria | 100.0 /100 | #14 | Exceptional 16.3% |
| Immigrants | Greece | 100.0 /100 | #15 | Exceptional 16.3% |