Palestinian vs Portuguese 5th Grade
COMPARE
Palestinian
Portuguese
5th Grade
5th Grade Comparison
Palestinians
Portuguese
97.5%
5TH GRADE
89.3/ 100
METRIC RATING
135th/ 347
METRIC RANK
97.1%
5TH GRADE
7.8/ 100
METRIC RATING
213th/ 347
METRIC RANK
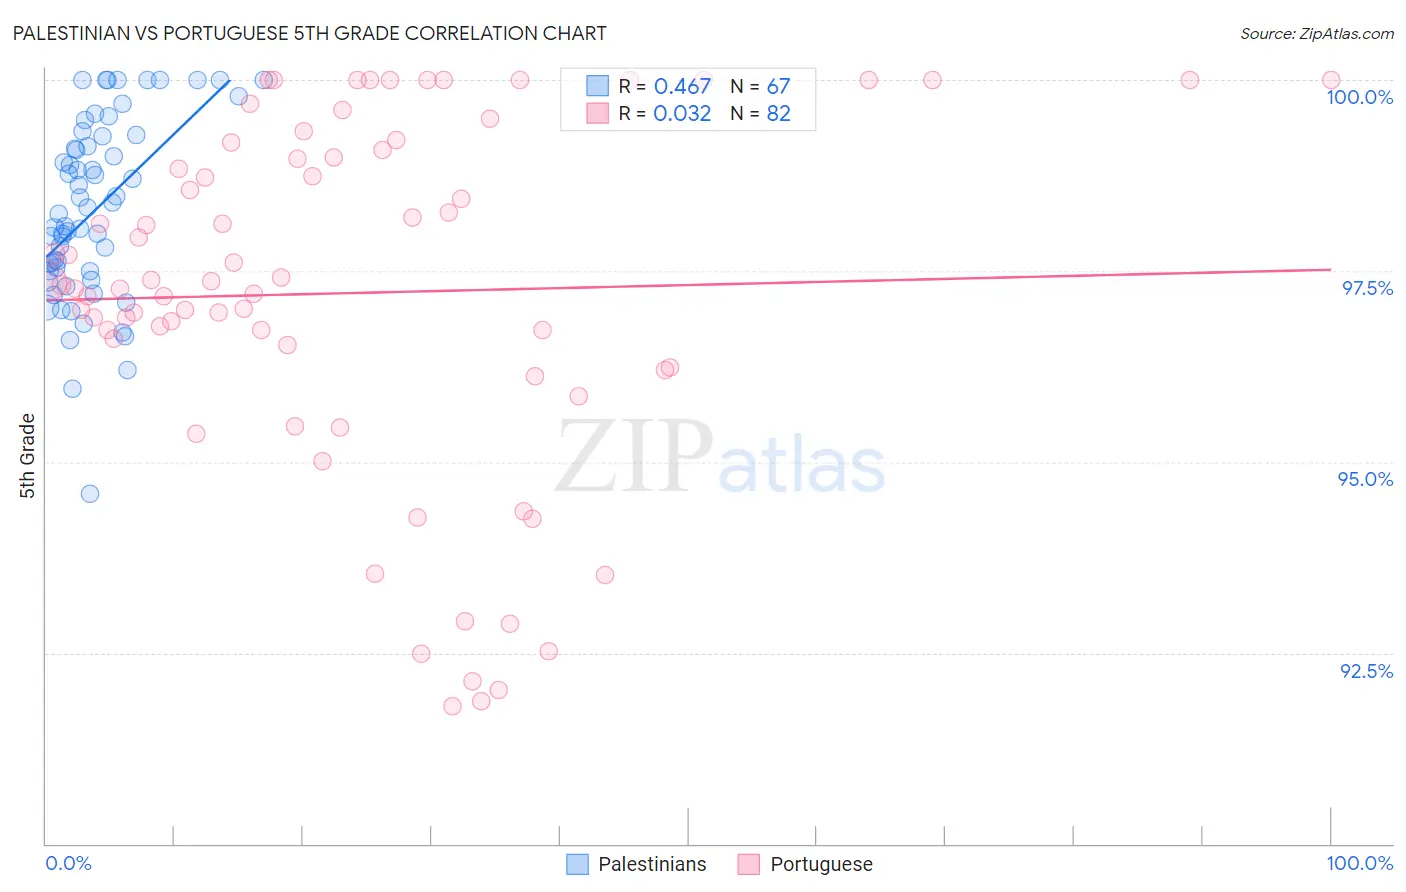
Palestinian vs Portuguese 5th Grade Correlation Chart
The statistical analysis conducted on geographies consisting of 216,424,519 people shows a moderate positive correlation between the proportion of Palestinians and percentage of population with at least 5th grade education in the United States with a correlation coefficient (R) of 0.467 and weighted average of 97.5%. Similarly, the statistical analysis conducted on geographies consisting of 450,351,764 people shows no correlation between the proportion of Portuguese and percentage of population with at least 5th grade education in the United States with a correlation coefficient (R) of 0.032 and weighted average of 97.1%, a difference of 0.48%.
5th Grade Correlation Summary
| Measurement | Palestinian | Portuguese |
| Minimum | 94.6% | 91.8% |
| Maximum | 100.0% | 100.0% |
| Range | 5.4% | 8.2% |
| Mean | 98.3% | 97.2% |
| Median | 98.3% | 97.3% |
| Interquartile 25% (IQ1) | 97.5% | 96.2% |
| Interquartile 75% (IQ3) | 99.3% | 99.1% |
| Interquartile Range (IQR) | 1.8% | 2.8% |
| Standard Deviation (Sample) | 1.2% | 2.3% |
| Standard Deviation (Population) | 1.2% | 2.3% |
Similar Demographics by 5th Grade
Demographics Similar to Palestinians by 5th Grade
In terms of 5th grade, the demographic groups most similar to Palestinians are Immigrants from Kuwait (97.6%, a difference of 0.010%), Cambodian (97.6%, a difference of 0.010%), Immigrants from Hungary (97.6%, a difference of 0.010%), Pima (97.6%, a difference of 0.020%), and Immigrants from Moldova (97.5%, a difference of 0.020%).
| Demographics | Rating | Rank | 5th Grade |
| Colville | 92.0 /100 | #128 | Exceptional 97.6% |
| Immigrants | Europe | 91.9 /100 | #129 | Exceptional 97.6% |
| Immigrants | Romania | 91.6 /100 | #130 | Exceptional 97.6% |
| Pima | 91.2 /100 | #131 | Exceptional 97.6% |
| Immigrants | Kuwait | 90.4 /100 | #132 | Exceptional 97.6% |
| Cambodians | 90.2 /100 | #133 | Exceptional 97.6% |
| Immigrants | Hungary | 90.1 /100 | #134 | Exceptional 97.6% |
| Palestinians | 89.3 /100 | #135 | Excellent 97.5% |
| Immigrants | Moldova | 87.5 /100 | #136 | Excellent 97.5% |
| Filipinos | 86.8 /100 | #137 | Excellent 97.5% |
| Blackfeet | 86.8 /100 | #138 | Excellent 97.5% |
| Immigrants | Turkey | 86.7 /100 | #139 | Excellent 97.5% |
| Burmese | 86.1 /100 | #140 | Excellent 97.5% |
| Seminole | 85.8 /100 | #141 | Excellent 97.5% |
| Israelis | 85.5 /100 | #142 | Excellent 97.5% |
Demographics Similar to Portuguese by 5th Grade
In terms of 5th grade, the demographic groups most similar to Portuguese are Costa Rican (97.1%, a difference of 0.0%), Immigrants from Morocco (97.1%, a difference of 0.0%), Samoan (97.1%, a difference of 0.010%), Immigrants from Iraq (97.1%, a difference of 0.010%), and Sudanese (97.1%, a difference of 0.010%).
| Demographics | Rating | Rank | 5th Grade |
| Paiute | 11.6 /100 | #206 | Poor 97.1% |
| Iraqis | 10.9 /100 | #207 | Poor 97.1% |
| Laotians | 10.8 /100 | #208 | Poor 97.1% |
| Immigrants | Nepal | 10.3 /100 | #209 | Poor 97.1% |
| Immigrants | Oceania | 10.0 /100 | #210 | Poor 97.1% |
| Samoans | 8.5 /100 | #211 | Tragic 97.1% |
| Immigrants | Iraq | 8.3 /100 | #212 | Tragic 97.1% |
| Portuguese | 7.8 /100 | #213 | Tragic 97.1% |
| Costa Ricans | 7.7 /100 | #214 | Tragic 97.1% |
| Immigrants | Morocco | 7.5 /100 | #215 | Tragic 97.1% |
| Sudanese | 7.0 /100 | #216 | Tragic 97.1% |
| Immigrants | Lebanon | 6.8 /100 | #217 | Tragic 97.1% |
| Immigrants | Sudan | 6.5 /100 | #218 | Tragic 97.1% |
| Immigrants | Syria | 6.4 /100 | #219 | Tragic 97.1% |
| Immigrants | Southern Europe | 6.3 /100 | #220 | Tragic 97.1% |