Seminole vs Yup'ik Doctorate Degree
COMPARE
Seminole
Yup'ik
Doctorate Degree
Doctorate Degree Comparison
Seminole
Yup'ik
1.3%
DOCTORATE DEGREE
0.1/ 100
METRIC RATING
322nd/ 347
METRIC RANK
1.3%
DOCTORATE DEGREE
0.0/ 100
METRIC RATING
330th/ 347
METRIC RANK
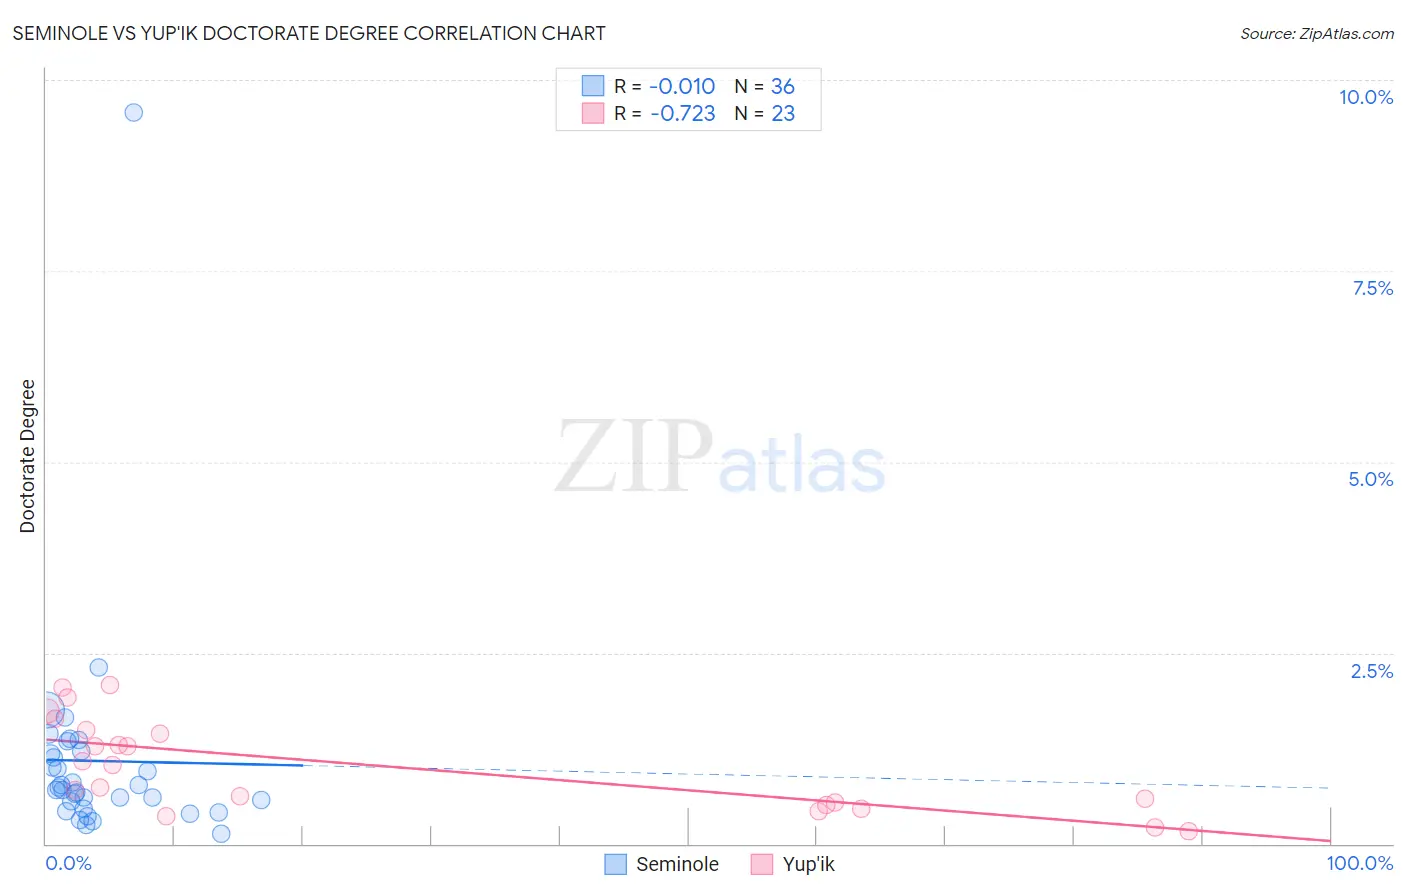
Seminole vs Yup'ik Doctorate Degree Correlation Chart
The statistical analysis conducted on geographies consisting of 117,553,493 people shows no correlation between the proportion of Seminole and percentage of population with at least doctorate degree education in the United States with a correlation coefficient (R) of -0.010 and weighted average of 1.3%. Similarly, the statistical analysis conducted on geographies consisting of 39,714,218 people shows a strong negative correlation between the proportion of Yup'ik and percentage of population with at least doctorate degree education in the United States with a correlation coefficient (R) of -0.723 and weighted average of 1.3%, a difference of 2.1%.
Doctorate Degree Correlation Summary
| Measurement | Seminole | Yup'ik |
| Minimum | 0.13% | 0.17% |
| Maximum | 9.6% | 2.1% |
| Range | 9.4% | 1.9% |
| Mean | 1.1% | 1.0% |
| Median | 0.72% | 1.0% |
| Interquartile 25% (IQ1) | 0.51% | 0.51% |
| Interquartile 75% (IQ3) | 1.2% | 1.5% |
| Interquartile Range (IQR) | 0.69% | 0.97% |
| Standard Deviation (Sample) | 1.5% | 0.60% |
| Standard Deviation (Population) | 1.5% | 0.59% |
Demographics Similar to Seminole and Yup'ik by Doctorate Degree
In terms of doctorate degree, the demographic groups most similar to Seminole are Dutch West Indian (1.3%, a difference of 0.060%), Immigrants from St. Vincent and the Grenadines (1.3%, a difference of 0.16%), Immigrants from Belize (1.3%, a difference of 0.20%), Immigrants from Guyana (1.3%, a difference of 0.23%), and Native/Alaskan (1.3%, a difference of 0.52%). Similarly, the demographic groups most similar to Yup'ik are Immigrants from Latin America (1.3%, a difference of 0.010%), Haitian (1.3%, a difference of 0.22%), Inupiat (1.3%, a difference of 0.27%), Hispanic or Latino (1.3%, a difference of 0.85%), and Immigrants from Cabo Verde (1.3%, a difference of 1.1%).
| Demographics | Rating | Rank | Doctorate Degree |
| Navajo | 0.1 /100 | #316 | Tragic 1.4% |
| Immigrants | Micronesia | 0.1 /100 | #317 | Tragic 1.3% |
| Creek | 0.1 /100 | #318 | Tragic 1.3% |
| Immigrants | Guyana | 0.1 /100 | #319 | Tragic 1.3% |
| Immigrants | St. Vincent and the Grenadines | 0.1 /100 | #320 | Tragic 1.3% |
| Dutch West Indians | 0.1 /100 | #321 | Tragic 1.3% |
| Seminole | 0.1 /100 | #322 | Tragic 1.3% |
| Immigrants | Belize | 0.1 /100 | #323 | Tragic 1.3% |
| Natives/Alaskans | 0.0 /100 | #324 | Tragic 1.3% |
| Pima | 0.0 /100 | #325 | Tragic 1.3% |
| Immigrants | Cabo Verde | 0.0 /100 | #326 | Tragic 1.3% |
| Hispanics or Latinos | 0.0 /100 | #327 | Tragic 1.3% |
| Inupiat | 0.0 /100 | #328 | Tragic 1.3% |
| Haitians | 0.0 /100 | #329 | Tragic 1.3% |
| Yup'ik | 0.0 /100 | #330 | Tragic 1.3% |
| Immigrants | Latin America | 0.0 /100 | #331 | Tragic 1.3% |
| Yakama | 0.0 /100 | #332 | Tragic 1.3% |
| Immigrants | Caribbean | 0.0 /100 | #333 | Tragic 1.3% |
| Immigrants | Dominican Republic | 0.0 /100 | #334 | Tragic 1.3% |
| Immigrants | Haiti | 0.0 /100 | #335 | Tragic 1.3% |
| Nepalese | 0.0 /100 | #336 | Tragic 1.3% |