Immigrants from Israel vs Immigrants from Austria 7th Grade
COMPARE
Immigrants from Israel
Immigrants from Austria
7th Grade
7th Grade Comparison
Immigrants from Israel
Immigrants from Austria
96.2%
7TH GRADE
77.6/ 100
METRIC RATING
154th/ 347
METRIC RANK
96.9%
7TH GRADE
99.7/ 100
METRIC RATING
64th/ 347
METRIC RANK
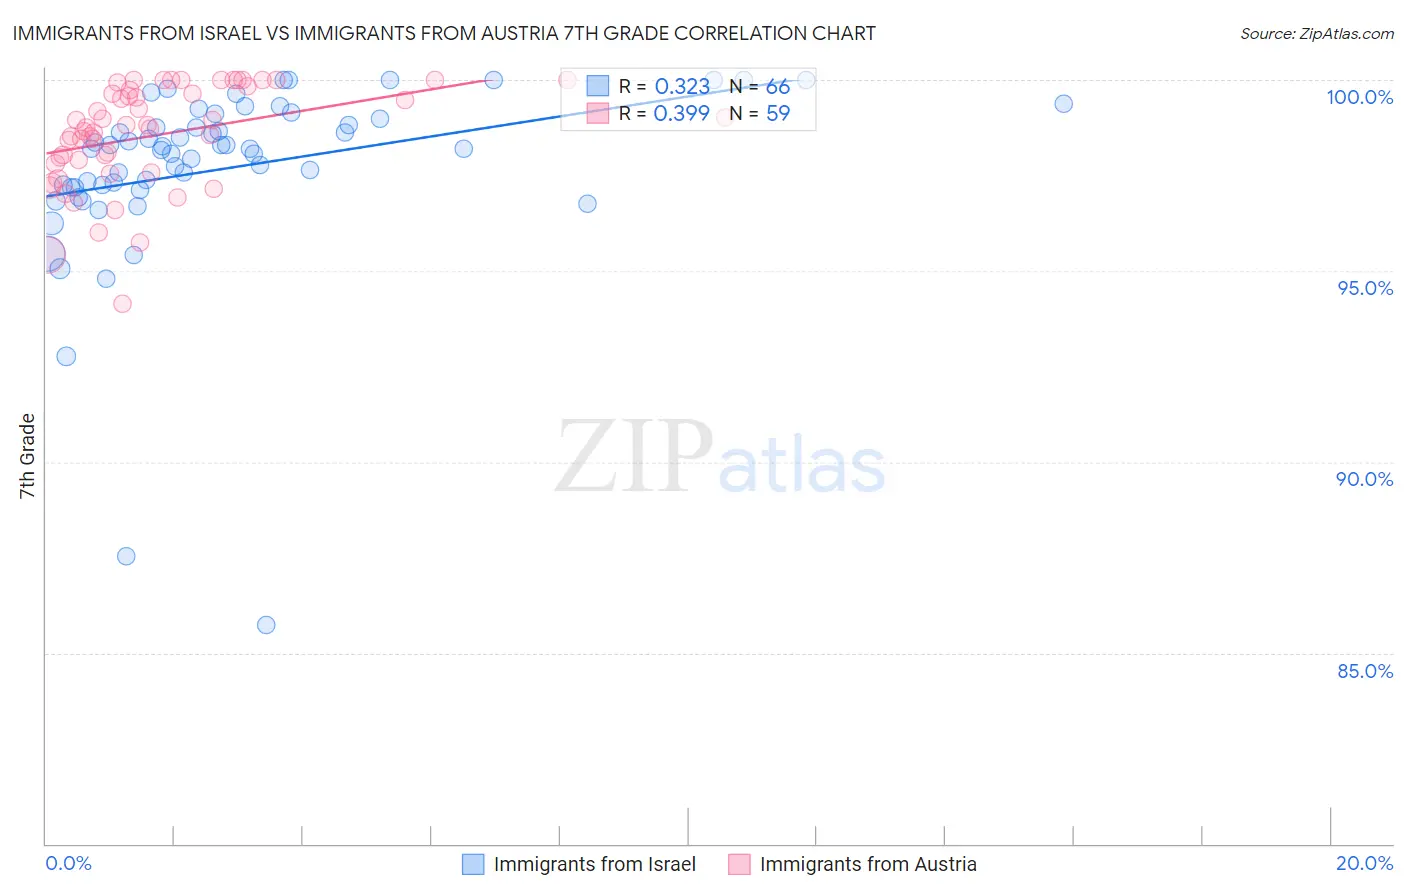
Immigrants from Israel vs Immigrants from Austria 7th Grade Correlation Chart
The statistical analysis conducted on geographies consisting of 210,030,386 people shows a mild positive correlation between the proportion of Immigrants from Israel and percentage of population with at least 7th grade education in the United States with a correlation coefficient (R) of 0.323 and weighted average of 96.2%. Similarly, the statistical analysis conducted on geographies consisting of 167,973,800 people shows a mild positive correlation between the proportion of Immigrants from Austria and percentage of population with at least 7th grade education in the United States with a correlation coefficient (R) of 0.399 and weighted average of 96.9%, a difference of 0.72%.
7th Grade Correlation Summary
| Measurement | Immigrants from Israel | Immigrants from Austria |
| Minimum | 85.7% | 94.1% |
| Maximum | 100.0% | 100.0% |
| Range | 14.3% | 5.9% |
| Mean | 97.7% | 98.6% |
| Median | 98.2% | 98.8% |
| Interquartile 25% (IQ1) | 97.2% | 97.8% |
| Interquartile 75% (IQ3) | 99.0% | 99.7% |
| Interquartile Range (IQR) | 1.8% | 1.9% |
| Standard Deviation (Sample) | 2.4% | 1.3% |
| Standard Deviation (Population) | 2.4% | 1.3% |
Similar Demographics by 7th Grade
Demographics Similar to Immigrants from Israel by 7th Grade
In terms of 7th grade, the demographic groups most similar to Immigrants from Israel are Seminole (96.2%, a difference of 0.0%), Immigrants from Jordan (96.2%, a difference of 0.0%), Immigrants from Russia (96.2%, a difference of 0.010%), Kenyan (96.2%, a difference of 0.010%), and Ugandan (96.2%, a difference of 0.020%).
| Demographics | Rating | Rank | 7th Grade |
| French American Indians | 83.1 /100 | #147 | Excellent 96.3% |
| Israelis | 82.8 /100 | #148 | Excellent 96.3% |
| Albanians | 82.6 /100 | #149 | Excellent 96.3% |
| Immigrants | Belarus | 82.4 /100 | #150 | Excellent 96.3% |
| Hopi | 81.6 /100 | #151 | Excellent 96.3% |
| Immigrants | Russia | 78.4 /100 | #152 | Good 96.2% |
| Seminole | 78.1 /100 | #153 | Good 96.2% |
| Immigrants | Israel | 77.6 /100 | #154 | Good 96.2% |
| Immigrants | Jordan | 77.0 /100 | #155 | Good 96.2% |
| Kenyans | 76.2 /100 | #156 | Good 96.2% |
| Ugandans | 75.5 /100 | #157 | Good 96.2% |
| Arabs | 68.6 /100 | #158 | Good 96.2% |
| Alsatians | 67.2 /100 | #159 | Good 96.1% |
| Immigrants | Kenya | 66.8 /100 | #160 | Good 96.1% |
| Bermudans | 66.3 /100 | #161 | Good 96.1% |
Demographics Similar to Immigrants from Austria by 7th Grade
In terms of 7th grade, the demographic groups most similar to Immigrants from Austria are Immigrants from Northern Europe (96.9%, a difference of 0.010%), Canadian (96.9%, a difference of 0.010%), Immigrants from North America (96.9%, a difference of 0.020%), Ukrainian (96.9%, a difference of 0.020%), and Native Hawaiian (96.9%, a difference of 0.020%).
| Demographics | Rating | Rank | 7th Grade |
| Americans | 99.8 /100 | #57 | Exceptional 97.0% |
| Whites/Caucasians | 99.8 /100 | #58 | Exceptional 97.0% |
| Macedonians | 99.8 /100 | #59 | Exceptional 97.0% |
| Immigrants | Canada | 99.8 /100 | #60 | Exceptional 96.9% |
| Creek | 99.8 /100 | #61 | Exceptional 96.9% |
| Immigrants | North America | 99.8 /100 | #62 | Exceptional 96.9% |
| Immigrants | Northern Europe | 99.7 /100 | #63 | Exceptional 96.9% |
| Immigrants | Austria | 99.7 /100 | #64 | Exceptional 96.9% |
| Canadians | 99.7 /100 | #65 | Exceptional 96.9% |
| Ukrainians | 99.7 /100 | #66 | Exceptional 96.9% |
| Native Hawaiians | 99.7 /100 | #67 | Exceptional 96.9% |
| Immigrants | India | 99.6 /100 | #68 | Exceptional 96.9% |
| Iranians | 99.6 /100 | #69 | Exceptional 96.8% |
| New Zealanders | 99.6 /100 | #70 | Exceptional 96.8% |
| Immigrants | Lithuania | 99.6 /100 | #71 | Exceptional 96.8% |