Ottawa vs Swedish GED/Equivalency
COMPARE
Ottawa
Swedish
GED/Equivalency
GED/Equivalency Comparison
Ottawa
Swedes
85.8%
GED/EQUIVALENCY
50.0/ 100
METRIC RATING
174th/ 347
METRIC RANK
88.8%
GED/EQUIVALENCY
99.9/ 100
METRIC RATING
19th/ 347
METRIC RANK
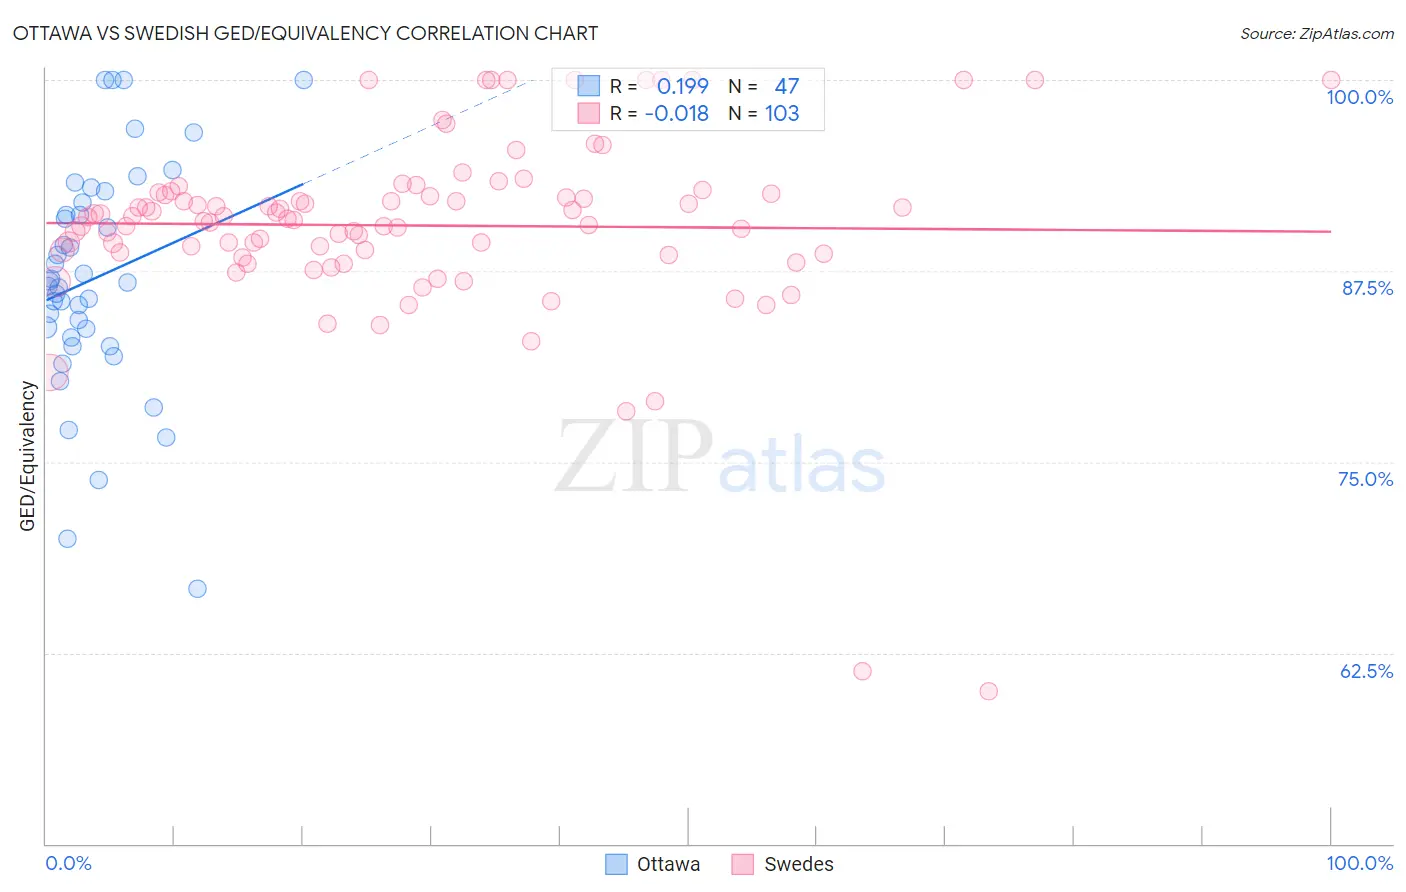
Ottawa vs Swedish GED/Equivalency Correlation Chart
The statistical analysis conducted on geographies consisting of 49,956,602 people shows a poor positive correlation between the proportion of Ottawa and percentage of population with at least ged/equivalency education in the United States with a correlation coefficient (R) of 0.199 and weighted average of 85.8%. Similarly, the statistical analysis conducted on geographies consisting of 539,231,677 people shows no correlation between the proportion of Swedes and percentage of population with at least ged/equivalency education in the United States with a correlation coefficient (R) of -0.018 and weighted average of 88.8%, a difference of 3.5%.
GED/Equivalency Correlation Summary
| Measurement | Ottawa | Swedish |
| Minimum | 66.7% | 60.0% |
| Maximum | 100.0% | 100.0% |
| Range | 33.3% | 40.0% |
| Mean | 87.0% | 90.5% |
| Median | 86.7% | 90.9% |
| Interquartile 25% (IQ1) | 83.1% | 88.6% |
| Interquartile 75% (IQ3) | 92.0% | 92.6% |
| Interquartile Range (IQR) | 8.9% | 4.0% |
| Standard Deviation (Sample) | 7.4% | 6.1% |
| Standard Deviation (Population) | 7.3% | 6.1% |
Similar Demographics by GED/Equivalency
Demographics Similar to Ottawa by GED/Equivalency
In terms of ged/equivalency, the demographic groups most similar to Ottawa are Immigrants from Bolivia (85.8%, a difference of 0.0%), Immigrants from Venezuela (85.8%, a difference of 0.010%), Immigrants from Eastern Africa (85.7%, a difference of 0.050%), Bermudan (85.8%, a difference of 0.10%), and Immigrants from Uganda (85.7%, a difference of 0.10%).
| Demographics | Rating | Rank | GED/Equivalency |
| Ethiopians | 63.7 /100 | #167 | Good 86.0% |
| Sierra Leoneans | 61.8 /100 | #168 | Good 86.0% |
| Immigrants | Ethiopia | 61.2 /100 | #169 | Good 86.0% |
| Afghans | 59.7 /100 | #170 | Average 85.9% |
| Immigrants | Chile | 57.3 /100 | #171 | Average 85.9% |
| Bermudans | 55.1 /100 | #172 | Average 85.8% |
| Immigrants | Venezuela | 50.7 /100 | #173 | Average 85.8% |
| Ottawa | 50.0 /100 | #174 | Average 85.8% |
| Immigrants | Bolivia | 49.8 /100 | #175 | Average 85.8% |
| Immigrants | Eastern Africa | 47.7 /100 | #176 | Average 85.7% |
| Immigrants | Uganda | 45.2 /100 | #177 | Average 85.7% |
| Koreans | 41.2 /100 | #178 | Average 85.6% |
| Aleuts | 40.5 /100 | #179 | Average 85.6% |
| Immigrants | Southern Europe | 38.4 /100 | #180 | Fair 85.5% |
| Moroccans | 37.7 /100 | #181 | Fair 85.5% |
Demographics Similar to Swedes by GED/Equivalency
In terms of ged/equivalency, the demographic groups most similar to Swedes are Slovene (88.8%, a difference of 0.050%), Croatian (88.8%, a difference of 0.080%), Immigrants from Taiwan (88.8%, a difference of 0.11%), Okinawan (88.9%, a difference of 0.14%), and Maltese (88.6%, a difference of 0.15%).
| Demographics | Rating | Rank | GED/Equivalency |
| Lithuanians | 99.9 /100 | #12 | Exceptional 88.9% |
| Immigrants | Iran | 99.9 /100 | #13 | Exceptional 88.9% |
| Cypriots | 99.9 /100 | #14 | Exceptional 88.9% |
| Okinawans | 99.9 /100 | #15 | Exceptional 88.9% |
| Immigrants | Taiwan | 99.9 /100 | #16 | Exceptional 88.8% |
| Croatians | 99.9 /100 | #17 | Exceptional 88.8% |
| Slovenes | 99.9 /100 | #18 | Exceptional 88.8% |
| Swedes | 99.9 /100 | #19 | Exceptional 88.8% |
| Maltese | 99.9 /100 | #20 | Exceptional 88.6% |
| Luxembourgers | 99.8 /100 | #21 | Exceptional 88.6% |
| Immigrants | Ireland | 99.8 /100 | #22 | Exceptional 88.6% |
| Russians | 99.8 /100 | #23 | Exceptional 88.6% |
| Slovaks | 99.8 /100 | #24 | Exceptional 88.6% |
| Estonians | 99.8 /100 | #25 | Exceptional 88.6% |
| Immigrants | Australia | 99.8 /100 | #26 | Exceptional 88.6% |