Carpatho Rusyn vs Lithuanian 12th Grade, No Diploma
COMPARE
Carpatho Rusyn
Lithuanian
12th Grade, No Diploma
12th Grade, No Diploma Comparison
Carpatho Rusyns
Lithuanians
93.6%
12TH GRADE, NO DIPLOMA
100.0/ 100
METRIC RATING
5th/ 347
METRIC RANK
93.6%
12TH GRADE, NO DIPLOMA
100.0/ 100
METRIC RATING
3rd/ 347
METRIC RANK
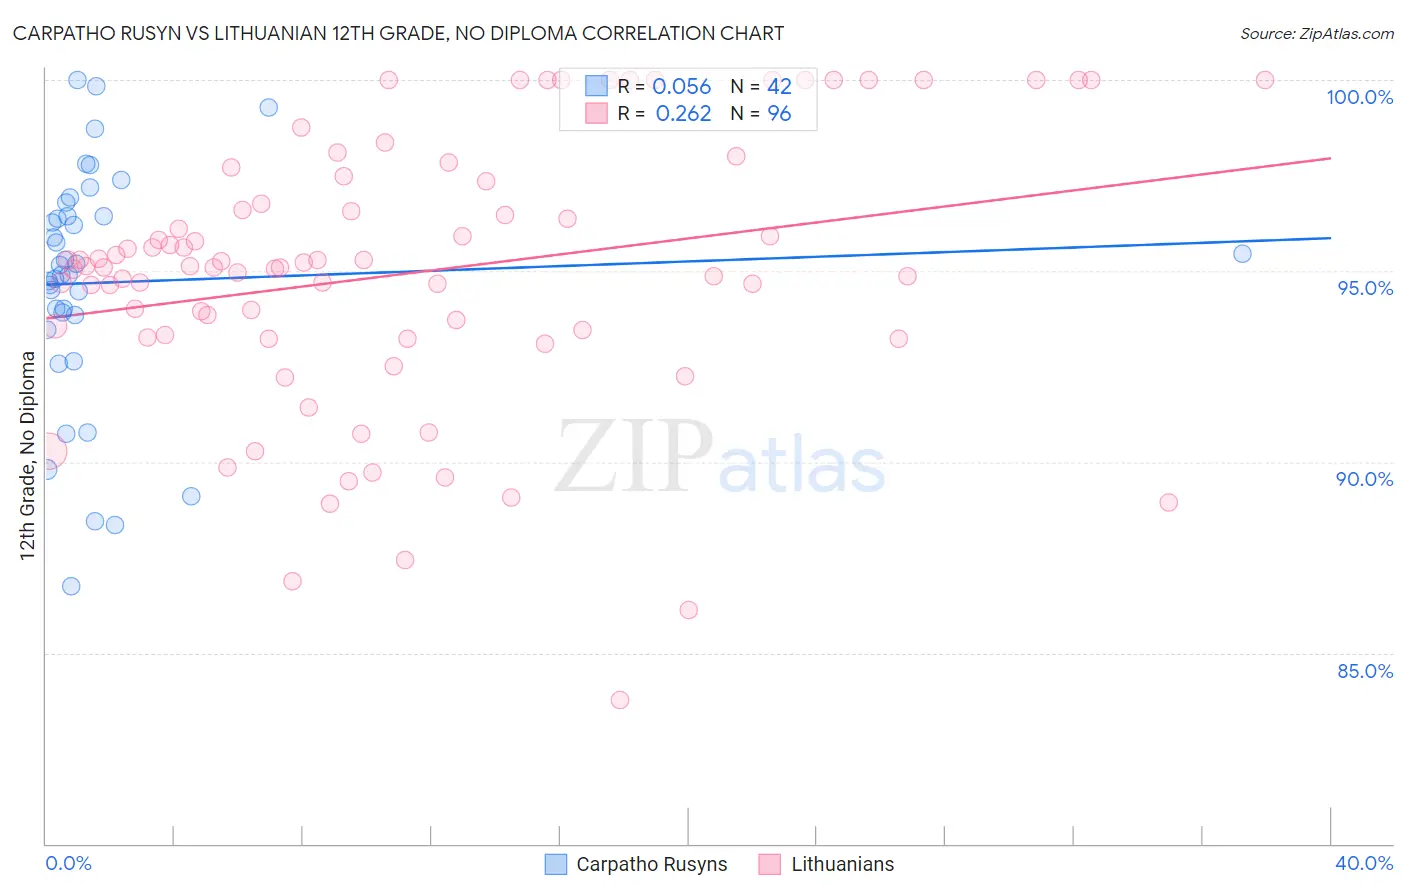
Carpatho Rusyn vs Lithuanian 12th Grade, No Diploma Correlation Chart
The statistical analysis conducted on geographies consisting of 58,871,690 people shows a slight positive correlation between the proportion of Carpatho Rusyns and percentage of population with at least 12th grade (no diploma) education in the United States with a correlation coefficient (R) of 0.056 and weighted average of 93.6%. Similarly, the statistical analysis conducted on geographies consisting of 421,947,832 people shows a weak positive correlation between the proportion of Lithuanians and percentage of population with at least 12th grade (no diploma) education in the United States with a correlation coefficient (R) of 0.262 and weighted average of 93.6%, a difference of 0.020%.
12th Grade, No Diploma Correlation Summary
| Measurement | Carpatho Rusyn | Lithuanian |
| Minimum | 86.7% | 83.8% |
| Maximum | 100.0% | 100.0% |
| Range | 13.3% | 16.2% |
| Mean | 94.7% | 94.9% |
| Median | 95.0% | 95.1% |
| Interquartile 25% (IQ1) | 93.8% | 93.3% |
| Interquartile 75% (IQ3) | 96.4% | 97.1% |
| Interquartile Range (IQR) | 2.6% | 3.8% |
| Standard Deviation (Sample) | 3.1% | 3.5% |
| Standard Deviation (Population) | 3.1% | 3.5% |
Demographics Similar to Carpatho Rusyns and Lithuanians by 12th Grade, No Diploma
In terms of 12th grade, no diploma, the demographic groups most similar to Carpatho Rusyns are Slovene (93.6%, a difference of 0.010%), Immigrants from India (93.6%, a difference of 0.010%), Slovak (93.6%, a difference of 0.050%), Chinese (93.6%, a difference of 0.060%), and Latvian (93.6%, a difference of 0.070%). Similarly, the demographic groups most similar to Lithuanians are Slovene (93.6%, a difference of 0.010%), Immigrants from India (93.6%, a difference of 0.030%), Slovak (93.6%, a difference of 0.070%), Chinese (93.6%, a difference of 0.070%), and Latvian (93.6%, a difference of 0.080%).
| Demographics | Rating | Rank | 12th Grade, No Diploma |
| Norwegians | 100.0 /100 | #1 | Exceptional 94.0% |
| Swedes | 100.0 /100 | #2 | Exceptional 93.7% |
| Lithuanians | 100.0 /100 | #3 | Exceptional 93.6% |
| Slovenes | 100.0 /100 | #4 | Exceptional 93.6% |
| Carpatho Rusyns | 100.0 /100 | #5 | Exceptional 93.6% |
| Immigrants | India | 100.0 /100 | #6 | Exceptional 93.6% |
| Slovaks | 100.0 /100 | #7 | Exceptional 93.6% |
| Chinese | 100.0 /100 | #8 | Exceptional 93.6% |
| Latvians | 100.0 /100 | #9 | Exceptional 93.6% |
| Croatians | 100.0 /100 | #10 | Exceptional 93.5% |
| Poles | 100.0 /100 | #11 | Exceptional 93.5% |
| Eastern Europeans | 100.0 /100 | #12 | Exceptional 93.5% |
| Danes | 100.0 /100 | #13 | Exceptional 93.5% |
| Bulgarians | 100.0 /100 | #14 | Exceptional 93.5% |
| Finns | 100.0 /100 | #15 | Exceptional 93.4% |
| Maltese | 100.0 /100 | #16 | Exceptional 93.3% |
| Luxembourgers | 100.0 /100 | #17 | Exceptional 93.3% |
| Immigrants | Singapore | 99.9 /100 | #18 | Exceptional 93.3% |
| Germans | 99.9 /100 | #19 | Exceptional 93.3% |
| Filipinos | 99.9 /100 | #20 | Exceptional 93.2% |