Serbian vs Immigrants from Hong Kong 5th Grade
COMPARE
Serbian
Immigrants from Hong Kong
5th Grade
5th Grade Comparison
Serbians
Immigrants from Hong Kong
97.9%
5TH GRADE
99.7/ 100
METRIC RATING
61st/ 347
METRIC RANK
96.7%
5TH GRADE
0.2/ 100
METRIC RATING
271st/ 347
METRIC RANK
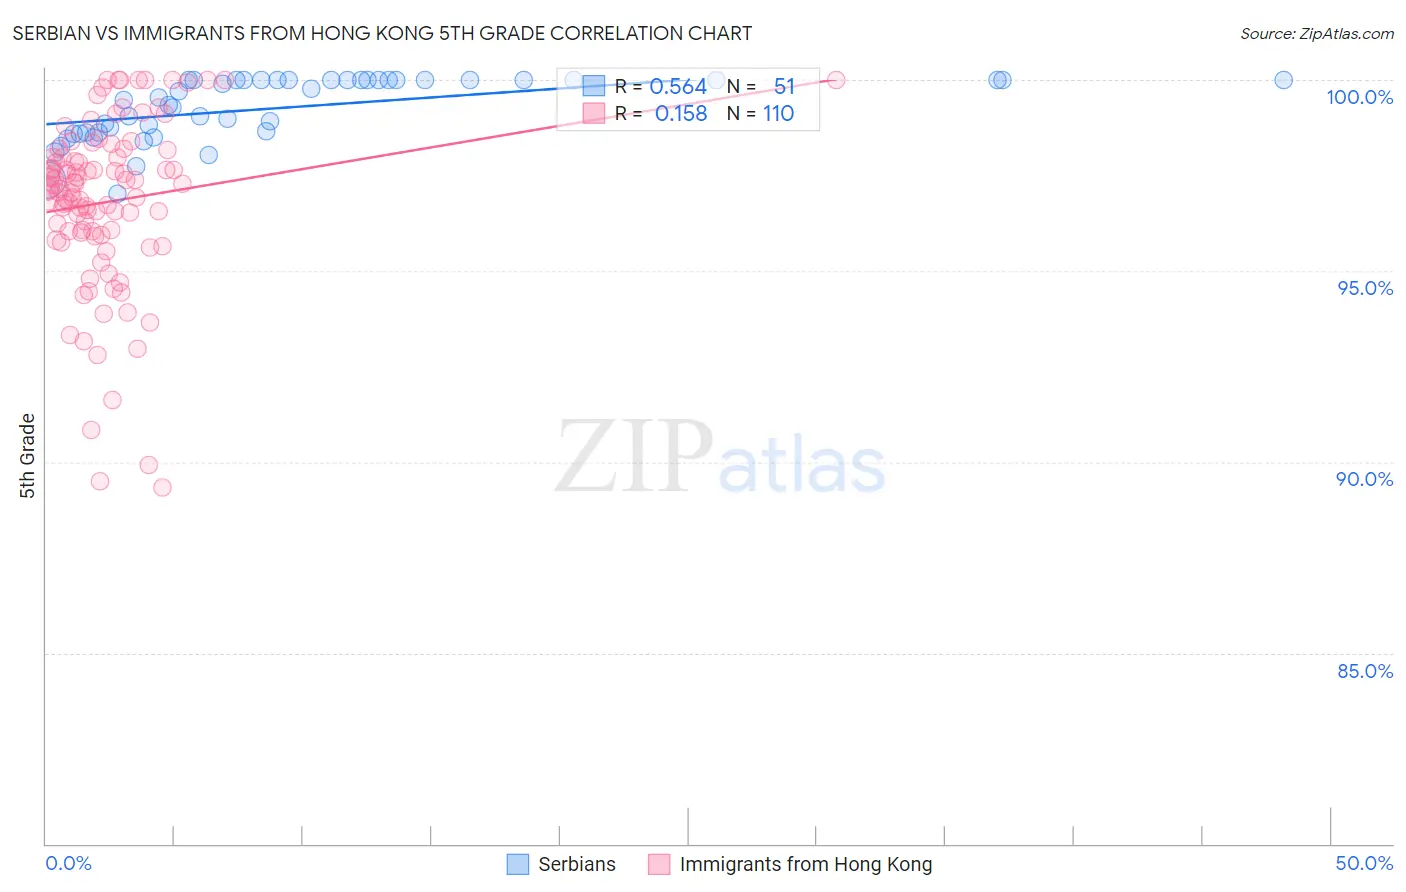
Serbian vs Immigrants from Hong Kong 5th Grade Correlation Chart
The statistical analysis conducted on geographies consisting of 267,642,942 people shows a substantial positive correlation between the proportion of Serbians and percentage of population with at least 5th grade education in the United States with a correlation coefficient (R) of 0.564 and weighted average of 97.9%. Similarly, the statistical analysis conducted on geographies consisting of 253,908,350 people shows a poor positive correlation between the proportion of Immigrants from Hong Kong and percentage of population with at least 5th grade education in the United States with a correlation coefficient (R) of 0.158 and weighted average of 96.7%, a difference of 1.3%.
5th Grade Correlation Summary
| Measurement | Serbian | Immigrants from Hong Kong |
| Minimum | 97.0% | 89.3% |
| Maximum | 100.0% | 100.0% |
| Range | 3.0% | 10.7% |
| Mean | 99.3% | 96.8% |
| Median | 99.5% | 97.2% |
| Interquartile 25% (IQ1) | 98.6% | 96.0% |
| Interquartile 75% (IQ3) | 100.0% | 98.0% |
| Interquartile Range (IQR) | 1.4% | 2.0% |
| Standard Deviation (Sample) | 0.81% | 2.2% |
| Standard Deviation (Population) | 0.81% | 2.2% |
Similar Demographics by 5th Grade
Demographics Similar to Serbians by 5th Grade
In terms of 5th grade, the demographic groups most similar to Serbians are Immigrants from North America (97.9%, a difference of 0.0%), Immigrants from Canada (97.9%, a difference of 0.010%), Russian (97.9%, a difference of 0.010%), American (97.9%, a difference of 0.020%), and Immigrants from Northern Europe (97.9%, a difference of 0.020%).
| Demographics | Rating | Rank | 5th Grade |
| Australians | 99.8 /100 | #54 | Exceptional 98.0% |
| Creek | 99.8 /100 | #55 | Exceptional 98.0% |
| Greeks | 99.8 /100 | #56 | Exceptional 97.9% |
| Austrians | 99.8 /100 | #57 | Exceptional 97.9% |
| Whites/Caucasians | 99.8 /100 | #58 | Exceptional 97.9% |
| Americans | 99.7 /100 | #59 | Exceptional 97.9% |
| Immigrants | Canada | 99.7 /100 | #60 | Exceptional 97.9% |
| Serbians | 99.7 /100 | #61 | Exceptional 97.9% |
| Immigrants | North America | 99.7 /100 | #62 | Exceptional 97.9% |
| Russians | 99.7 /100 | #63 | Exceptional 97.9% |
| Immigrants | Northern Europe | 99.6 /100 | #64 | Exceptional 97.9% |
| Canadians | 99.6 /100 | #65 | Exceptional 97.9% |
| Immigrants | Austria | 99.6 /100 | #66 | Exceptional 97.9% |
| New Zealanders | 99.6 /100 | #67 | Exceptional 97.9% |
| Cajuns | 99.6 /100 | #68 | Exceptional 97.9% |
Demographics Similar to Immigrants from Hong Kong by 5th Grade
In terms of 5th grade, the demographic groups most similar to Immigrants from Hong Kong are Afghan (96.7%, a difference of 0.0%), Trinidadian and Tobagonian (96.7%, a difference of 0.010%), Yaqui (96.7%, a difference of 0.020%), Immigrants from Cameroon (96.7%, a difference of 0.020%), and Immigrants from Peru (96.6%, a difference of 0.030%).
| Demographics | Rating | Rank | 5th Grade |
| West Indians | 0.3 /100 | #264 | Tragic 96.8% |
| Taiwanese | 0.3 /100 | #265 | Tragic 96.7% |
| Immigrants | Nigeria | 0.3 /100 | #266 | Tragic 96.7% |
| Immigrants | South America | 0.3 /100 | #267 | Tragic 96.7% |
| Armenians | 0.3 /100 | #268 | Tragic 96.7% |
| Ghanaians | 0.2 /100 | #269 | Tragic 96.7% |
| Afghans | 0.2 /100 | #270 | Tragic 96.7% |
| Immigrants | Hong Kong | 0.2 /100 | #271 | Tragic 96.7% |
| Trinidadians and Tobagonians | 0.1 /100 | #272 | Tragic 96.7% |
| Yaqui | 0.1 /100 | #273 | Tragic 96.7% |
| Immigrants | Cameroon | 0.1 /100 | #274 | Tragic 96.7% |
| Immigrants | Peru | 0.1 /100 | #275 | Tragic 96.6% |
| Cubans | 0.1 /100 | #276 | Tragic 96.6% |
| Immigrants | Bolivia | 0.1 /100 | #277 | Tragic 96.6% |
| Immigrants | Ghana | 0.1 /100 | #278 | Tragic 96.6% |