Immigrants from Northern Africa vs Peruvian 11th Grade
COMPARE
Immigrants from Northern Africa
Peruvian
11th Grade
11th Grade Comparison
Immigrants from Northern Africa
Peruvians
92.6%
11TH GRADE
57.3/ 100
METRIC RATING
170th/ 347
METRIC RANK
91.5%
11TH GRADE
1.0/ 100
METRIC RATING
249th/ 347
METRIC RANK
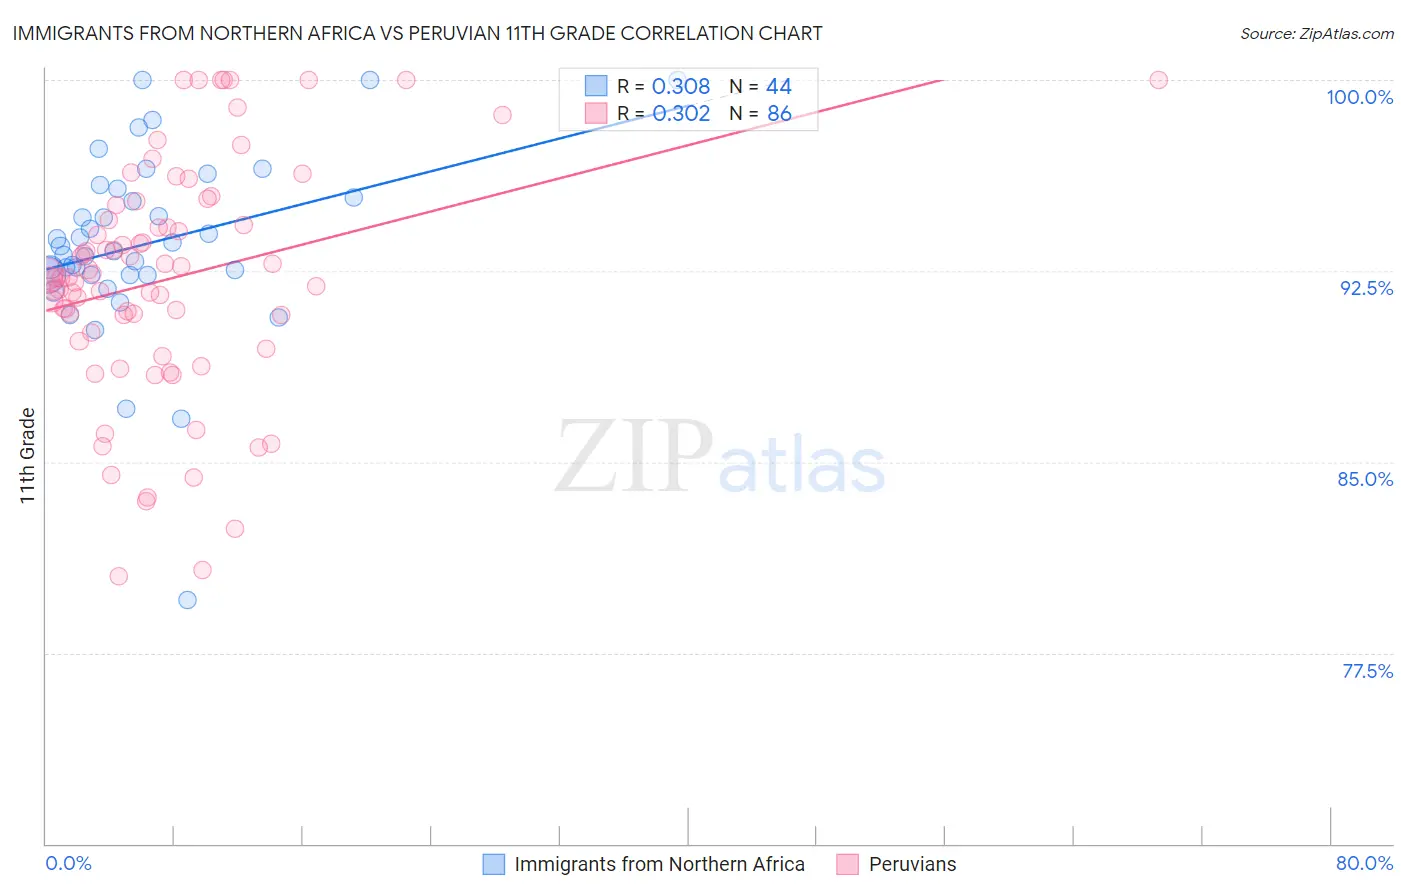
Immigrants from Northern Africa vs Peruvian 11th Grade Correlation Chart
The statistical analysis conducted on geographies consisting of 321,196,768 people shows a mild positive correlation between the proportion of Immigrants from Northern Africa and percentage of population with at least 11th grade education in the United States with a correlation coefficient (R) of 0.308 and weighted average of 92.6%. Similarly, the statistical analysis conducted on geographies consisting of 363,251,075 people shows a mild positive correlation between the proportion of Peruvians and percentage of population with at least 11th grade education in the United States with a correlation coefficient (R) of 0.302 and weighted average of 91.5%, a difference of 1.2%.
11th Grade Correlation Summary
| Measurement | Immigrants from Northern Africa | Peruvian |
| Minimum | 79.6% | 80.5% |
| Maximum | 100.0% | 100.0% |
| Range | 20.4% | 19.5% |
| Mean | 93.6% | 92.2% |
| Median | 93.4% | 92.2% |
| Interquartile 25% (IQ1) | 92.3% | 90.1% |
| Interquartile 75% (IQ3) | 95.6% | 94.5% |
| Interquartile Range (IQR) | 3.2% | 4.4% |
| Standard Deviation (Sample) | 3.6% | 4.5% |
| Standard Deviation (Population) | 3.6% | 4.5% |
Similar Demographics by 11th Grade
Demographics Similar to Immigrants from Northern Africa by 11th Grade
In terms of 11th grade, the demographic groups most similar to Immigrants from Northern Africa are Immigrants from Albania (92.6%, a difference of 0.0%), Sierra Leonean (92.6%, a difference of 0.010%), Alsatian (92.6%, a difference of 0.030%), Laotian (92.6%, a difference of 0.030%), and Bermudan (92.6%, a difference of 0.050%).
| Demographics | Rating | Rank | 11th Grade |
| Immigrants | Nonimmigrants | 66.6 /100 | #163 | Good 92.7% |
| Spanish | 66.2 /100 | #164 | Good 92.7% |
| Immigrants | Iraq | 63.7 /100 | #165 | Good 92.6% |
| Bermudans | 62.3 /100 | #166 | Good 92.6% |
| Alsatians | 60.2 /100 | #167 | Good 92.6% |
| Sierra Leoneans | 58.7 /100 | #168 | Average 92.6% |
| Immigrants | Albania | 57.8 /100 | #169 | Average 92.6% |
| Immigrants | Northern Africa | 57.3 /100 | #170 | Average 92.6% |
| Laotians | 54.4 /100 | #171 | Average 92.6% |
| Immigrants | Pakistan | 52.3 /100 | #172 | Average 92.5% |
| Indians (Asian) | 51.5 /100 | #173 | Average 92.5% |
| Asians | 50.0 /100 | #174 | Average 92.5% |
| Shoshone | 48.9 /100 | #175 | Average 92.5% |
| Spaniards | 46.9 /100 | #176 | Average 92.5% |
| Guamanians/Chamorros | 45.0 /100 | #177 | Average 92.5% |
Demographics Similar to Peruvians by 11th Grade
In terms of 11th grade, the demographic groups most similar to Peruvians are Immigrants from Uzbekistan (91.5%, a difference of 0.0%), Ghanaian (91.5%, a difference of 0.0%), Immigrants from Philippines (91.5%, a difference of 0.010%), Immigrants from Costa Rica (91.4%, a difference of 0.020%), and Immigrants from Nigeria (91.4%, a difference of 0.040%).
| Demographics | Rating | Rank | 11th Grade |
| Immigrants | Middle Africa | 1.6 /100 | #242 | Tragic 91.6% |
| Immigrants | Thailand | 1.4 /100 | #243 | Tragic 91.6% |
| Senegalese | 1.4 /100 | #244 | Tragic 91.6% |
| Africans | 1.3 /100 | #245 | Tragic 91.5% |
| Seminole | 1.2 /100 | #246 | Tragic 91.5% |
| Immigrants | Philippines | 1.0 /100 | #247 | Tragic 91.5% |
| Immigrants | Uzbekistan | 1.0 /100 | #248 | Tragic 91.5% |
| Peruvians | 1.0 /100 | #249 | Tragic 91.5% |
| Ghanaians | 0.9 /100 | #250 | Tragic 91.5% |
| Immigrants | Costa Rica | 0.9 /100 | #251 | Tragic 91.4% |
| Immigrants | Nigeria | 0.8 /100 | #252 | Tragic 91.4% |
| Immigrants | South America | 0.8 /100 | #253 | Tragic 91.4% |
| Immigrants | Eritrea | 0.7 /100 | #254 | Tragic 91.4% |
| Blacks/African Americans | 0.7 /100 | #255 | Tragic 91.4% |
| Immigrants | Senegal | 0.7 /100 | #256 | Tragic 91.4% |