Norwegian vs Immigrants from Western Asia 10th Grade
COMPARE
Norwegian
Immigrants from Western Asia
10th Grade
10th Grade Comparison
Norwegians
Immigrants from Western Asia
96.2%
10TH GRADE
100.0/ 100
METRIC RATING
1st/ 347
METRIC RANK
93.4%
10TH GRADE
20.6/ 100
METRIC RATING
203rd/ 347
METRIC RANK
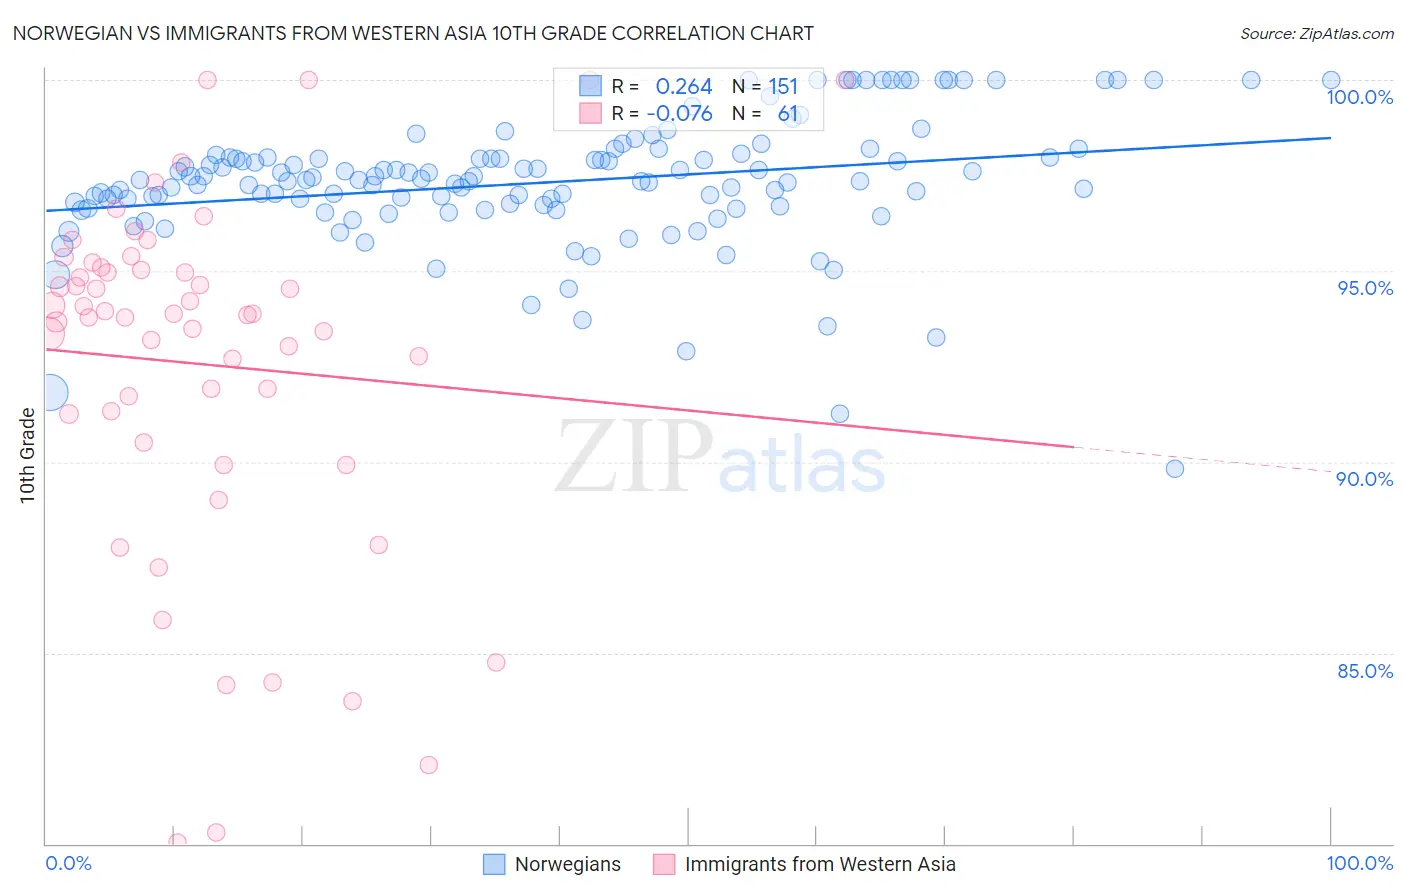
Norwegian vs Immigrants from Western Asia 10th Grade Correlation Chart
The statistical analysis conducted on geographies consisting of 533,395,175 people shows a weak positive correlation between the proportion of Norwegians and percentage of population with at least 10th grade education in the United States with a correlation coefficient (R) of 0.264 and weighted average of 96.2%. Similarly, the statistical analysis conducted on geographies consisting of 404,433,811 people shows a slight negative correlation between the proportion of Immigrants from Western Asia and percentage of population with at least 10th grade education in the United States with a correlation coefficient (R) of -0.076 and weighted average of 93.4%, a difference of 2.9%.
10th Grade Correlation Summary
| Measurement | Norwegian | Immigrants from Western Asia |
| Minimum | 89.8% | 80.0% |
| Maximum | 100.0% | 100.0% |
| Range | 10.2% | 20.0% |
| Mean | 97.3% | 92.6% |
| Median | 97.4% | 93.8% |
| Interquartile 25% (IQ1) | 96.7% | 90.9% |
| Interquartile 75% (IQ3) | 98.0% | 95.1% |
| Interquartile Range (IQR) | 1.3% | 4.2% |
| Standard Deviation (Sample) | 1.7% | 4.6% |
| Standard Deviation (Population) | 1.7% | 4.6% |
Similar Demographics by 10th Grade
Demographics Similar to Norwegians by 10th Grade
In terms of 10th grade, the demographic groups most similar to Norwegians are Slovak (96.0%, a difference of 0.13%), Slovene (95.9%, a difference of 0.24%), Swedish (95.9%, a difference of 0.24%), Carpatho Rusyn (95.9%, a difference of 0.26%), and Polish (95.8%, a difference of 0.36%).
| Demographics | Rating | Rank | 10th Grade |
| Norwegians | 100.0 /100 | #1 | Exceptional 96.2% |
| Slovaks | 100.0 /100 | #2 | Exceptional 96.0% |
| Slovenes | 100.0 /100 | #3 | Exceptional 95.9% |
| Swedes | 100.0 /100 | #4 | Exceptional 95.9% |
| Carpatho Rusyns | 100.0 /100 | #5 | Exceptional 95.9% |
| Poles | 100.0 /100 | #6 | Exceptional 95.8% |
| Germans | 100.0 /100 | #7 | Exceptional 95.8% |
| Lithuanians | 100.0 /100 | #8 | Exceptional 95.8% |
| Finns | 100.0 /100 | #9 | Exceptional 95.8% |
| Croatians | 100.0 /100 | #10 | Exceptional 95.7% |
| Danes | 100.0 /100 | #11 | Exceptional 95.7% |
| Tlingit-Haida | 100.0 /100 | #12 | Exceptional 95.7% |
| English | 100.0 /100 | #13 | Exceptional 95.6% |
| Tsimshian | 100.0 /100 | #14 | Exceptional 95.6% |
| Irish | 100.0 /100 | #15 | Exceptional 95.6% |
Demographics Similar to Immigrants from Western Asia by 10th Grade
In terms of 10th grade, the demographic groups most similar to Immigrants from Western Asia are Ute (93.4%, a difference of 0.0%), Immigrants from Indonesia (93.4%, a difference of 0.0%), Immigrants from Uganda (93.5%, a difference of 0.010%), Immigrants from Sudan (93.4%, a difference of 0.010%), and Samoan (93.4%, a difference of 0.010%).
| Demographics | Rating | Rank | 10th Grade |
| Moroccans | 25.3 /100 | #196 | Fair 93.5% |
| Pueblo | 23.9 /100 | #197 | Fair 93.5% |
| Immigrants | Micronesia | 23.2 /100 | #198 | Fair 93.5% |
| Asians | 23.0 /100 | #199 | Fair 93.5% |
| Hopi | 22.2 /100 | #200 | Fair 93.5% |
| Hawaiians | 21.8 /100 | #201 | Fair 93.5% |
| Immigrants | Uganda | 20.9 /100 | #202 | Fair 93.5% |
| Immigrants | Western Asia | 20.6 /100 | #203 | Fair 93.4% |
| Ute | 20.3 /100 | #204 | Fair 93.4% |
| Immigrants | Indonesia | 20.2 /100 | #205 | Fair 93.4% |
| Immigrants | Sudan | 20.0 /100 | #206 | Fair 93.4% |
| Samoans | 19.5 /100 | #207 | Poor 93.4% |
| Immigrants | Syria | 19.4 /100 | #208 | Poor 93.4% |
| Immigrants | Chile | 18.8 /100 | #209 | Poor 93.4% |
| Indians (Asian) | 17.6 /100 | #210 | Poor 93.4% |