Norwegian vs Colville Professional Degree
COMPARE
Norwegian
Colville
Professional Degree
Professional Degree Comparison
Norwegians
Colville
4.2%
PROFESSIONAL DEGREE
20.5/ 100
METRIC RATING
199th/ 347
METRIC RANK
3.8%
PROFESSIONAL DEGREE
2.6/ 100
METRIC RATING
238th/ 347
METRIC RANK
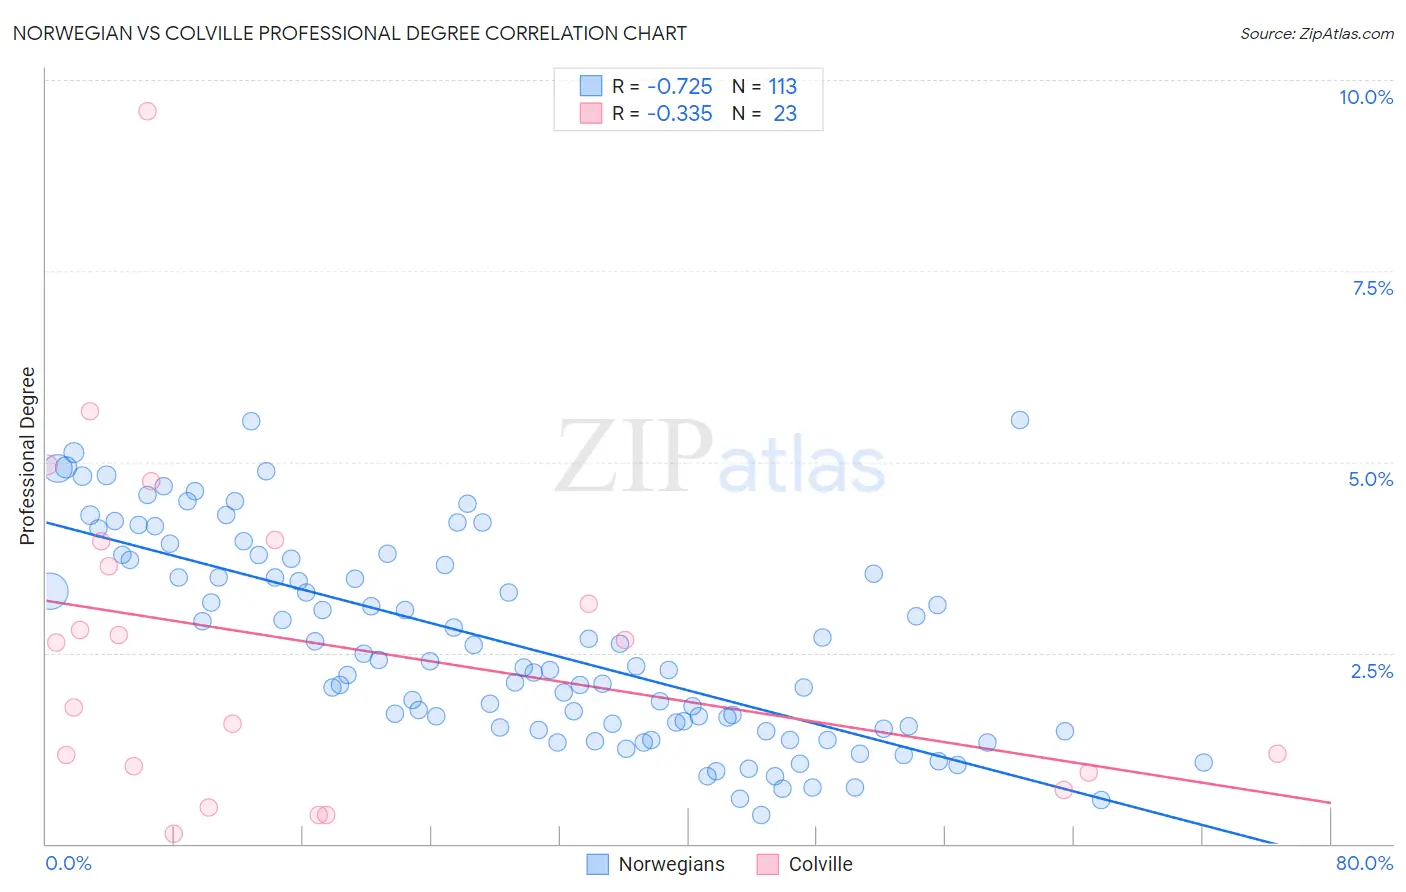
Norwegian vs Colville Professional Degree Correlation Chart
The statistical analysis conducted on geographies consisting of 528,458,292 people shows a strong negative correlation between the proportion of Norwegians and percentage of population with at least professional degree education in the United States with a correlation coefficient (R) of -0.725 and weighted average of 4.2%. Similarly, the statistical analysis conducted on geographies consisting of 34,643,390 people shows a mild negative correlation between the proportion of Colville and percentage of population with at least professional degree education in the United States with a correlation coefficient (R) of -0.335 and weighted average of 3.8%, a difference of 9.4%.
Professional Degree Correlation Summary
| Measurement | Norwegian | Colville |
| Minimum | 0.38% | 0.12% |
| Maximum | 5.6% | 9.6% |
| Range | 5.2% | 9.5% |
| Mean | 2.6% | 2.6% |
| Median | 2.3% | 2.6% |
| Interquartile 25% (IQ1) | 1.5% | 0.93% |
| Interquartile 75% (IQ3) | 3.7% | 4.0% |
| Interquartile Range (IQR) | 2.2% | 3.0% |
| Standard Deviation (Sample) | 1.3% | 2.2% |
| Standard Deviation (Population) | 1.3% | 2.2% |
Similar Demographics by Professional Degree
Demographics Similar to Norwegians by Professional Degree
In terms of professional degree, the demographic groups most similar to Norwegians are Immigrants from North Macedonia (4.2%, a difference of 0.080%), Immigrants from Middle Africa (4.2%, a difference of 0.37%), Czechoslovakian (4.2%, a difference of 0.42%), Finnish (4.2%, a difference of 0.44%), and Spanish (4.2%, a difference of 0.56%).
| Demographics | Rating | Rank | Professional Degree |
| Ghanaians | 27.3 /100 | #192 | Fair 4.3% |
| French | 27.1 /100 | #193 | Fair 4.2% |
| Scandinavians | 25.8 /100 | #194 | Fair 4.2% |
| Nigerians | 24.6 /100 | #195 | Fair 4.2% |
| Spanish | 23.0 /100 | #196 | Fair 4.2% |
| Czechoslovakians | 22.4 /100 | #197 | Fair 4.2% |
| Immigrants | Middle Africa | 22.1 /100 | #198 | Fair 4.2% |
| Norwegians | 20.5 /100 | #199 | Fair 4.2% |
| Immigrants | North Macedonia | 20.2 /100 | #200 | Fair 4.2% |
| Finns | 18.7 /100 | #201 | Poor 4.2% |
| Immigrants | Iraq | 17.1 /100 | #202 | Poor 4.2% |
| Panamanians | 15.9 /100 | #203 | Poor 4.1% |
| Barbadians | 15.8 /100 | #204 | Poor 4.1% |
| Somalis | 14.8 /100 | #205 | Poor 4.1% |
| Yugoslavians | 13.4 /100 | #206 | Poor 4.1% |
Demographics Similar to Colville by Professional Degree
In terms of professional degree, the demographic groups most similar to Colville are British West Indian (3.8%, a difference of 0.39%), Immigrants from Ecuador (3.8%, a difference of 0.62%), Alaskan Athabascan (3.8%, a difference of 0.64%), Native Hawaiian (3.8%, a difference of 0.64%), and Guamanian/Chamorro (3.8%, a difference of 0.72%).
| Demographics | Rating | Rank | Professional Degree |
| Ecuadorians | 4.6 /100 | #231 | Tragic 3.9% |
| Cree | 4.3 /100 | #232 | Tragic 3.9% |
| Immigrants | Philippines | 4.1 /100 | #233 | Tragic 3.9% |
| Immigrants | Nonimmigrants | 4.0 /100 | #234 | Tragic 3.9% |
| Immigrants | Barbados | 4.0 /100 | #235 | Tragic 3.9% |
| Spanish Americans | 3.8 /100 | #236 | Tragic 3.9% |
| Immigrants | Trinidad and Tobago | 3.8 /100 | #237 | Tragic 3.9% |
| Colville | 2.6 /100 | #238 | Tragic 3.8% |
| British West Indians | 2.4 /100 | #239 | Tragic 3.8% |
| Immigrants | Ecuador | 2.3 /100 | #240 | Tragic 3.8% |
| Alaskan Athabascans | 2.3 /100 | #241 | Tragic 3.8% |
| Native Hawaiians | 2.3 /100 | #242 | Tragic 3.8% |
| Guamanians/Chamorros | 2.2 /100 | #243 | Tragic 3.8% |
| Immigrants | Bahamas | 2.0 /100 | #244 | Tragic 3.8% |
| French American Indians | 1.7 /100 | #245 | Tragic 3.8% |