Northern European vs Immigrants from Croatia 9th Grade
COMPARE
Northern European
Immigrants from Croatia
9th Grade
9th Grade Comparison
Northern Europeans
Immigrants from Croatia
96.2%
9TH GRADE
99.9/ 100
METRIC RATING
36th/ 347
METRIC RANK
95.4%
9TH GRADE
96.2/ 100
METRIC RATING
112th/ 347
METRIC RANK
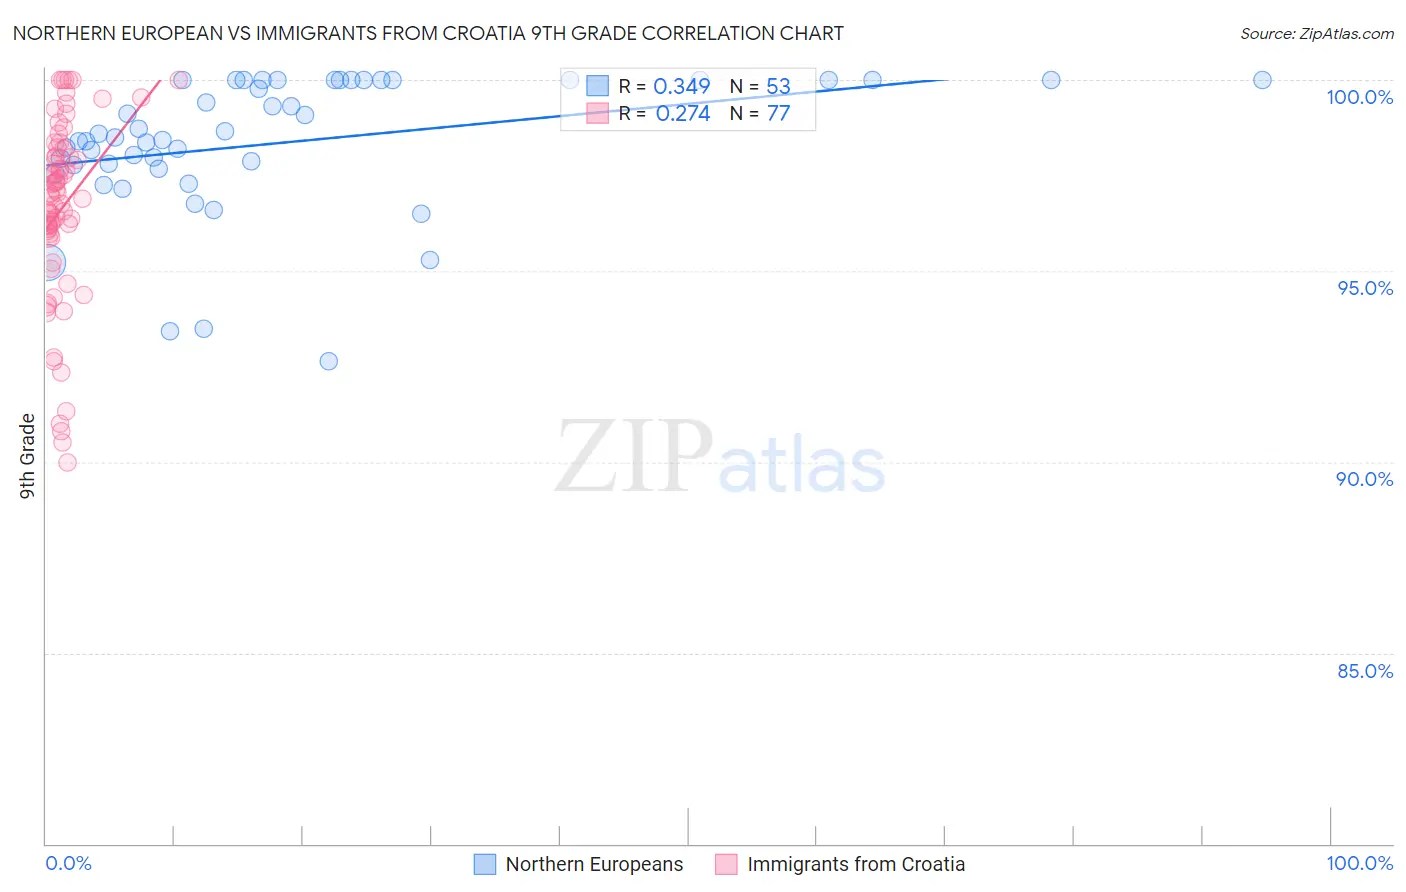
Northern European vs Immigrants from Croatia 9th Grade Correlation Chart
The statistical analysis conducted on geographies consisting of 406,096,351 people shows a mild positive correlation between the proportion of Northern Europeans and percentage of population with at least 9th grade education in the United States with a correlation coefficient (R) of 0.349 and weighted average of 96.2%. Similarly, the statistical analysis conducted on geographies consisting of 132,548,291 people shows a weak positive correlation between the proportion of Immigrants from Croatia and percentage of population with at least 9th grade education in the United States with a correlation coefficient (R) of 0.274 and weighted average of 95.4%, a difference of 0.78%.
9th Grade Correlation Summary
| Measurement | Northern European | Immigrants from Croatia |
| Minimum | 92.6% | 90.0% |
| Maximum | 100.0% | 100.0% |
| Range | 7.4% | 10.0% |
| Mean | 98.4% | 96.6% |
| Median | 98.5% | 97.0% |
| Interquartile 25% (IQ1) | 97.7% | 95.9% |
| Interquartile 75% (IQ3) | 100.0% | 98.1% |
| Interquartile Range (IQR) | 2.3% | 2.2% |
| Standard Deviation (Sample) | 1.8% | 2.4% |
| Standard Deviation (Population) | 1.8% | 2.4% |
Similar Demographics by 9th Grade
Demographics Similar to Northern Europeans by 9th Grade
In terms of 9th grade, the demographic groups most similar to Northern Europeans are Bulgarian (96.2%, a difference of 0.010%), Hungarian (96.2%, a difference of 0.040%), Estonian (96.1%, a difference of 0.040%), Immigrants from Scotland (96.1%, a difference of 0.040%), and Ottawa (96.1%, a difference of 0.060%).
| Demographics | Rating | Rank | 9th Grade |
| Chinese | 100.0 /100 | #29 | Exceptional 96.3% |
| Maltese | 100.0 /100 | #30 | Exceptional 96.3% |
| British | 100.0 /100 | #31 | Exceptional 96.3% |
| Belgians | 100.0 /100 | #32 | Exceptional 96.3% |
| Luxembourgers | 100.0 /100 | #33 | Exceptional 96.3% |
| Hungarians | 100.0 /100 | #34 | Exceptional 96.2% |
| Bulgarians | 99.9 /100 | #35 | Exceptional 96.2% |
| Northern Europeans | 99.9 /100 | #36 | Exceptional 96.2% |
| Estonians | 99.9 /100 | #37 | Exceptional 96.1% |
| Immigrants | Scotland | 99.9 /100 | #38 | Exceptional 96.1% |
| Ottawa | 99.9 /100 | #39 | Exceptional 96.1% |
| Slavs | 99.9 /100 | #40 | Exceptional 96.1% |
| Czechoslovakians | 99.9 /100 | #41 | Exceptional 96.1% |
| Chippewa | 99.9 /100 | #42 | Exceptional 96.1% |
| Iranians | 99.9 /100 | #43 | Exceptional 96.1% |
Demographics Similar to Immigrants from Croatia by 9th Grade
In terms of 9th grade, the demographic groups most similar to Immigrants from Croatia are Cherokee (95.4%, a difference of 0.0%), Iroquois (95.4%, a difference of 0.0%), German Russian (95.4%, a difference of 0.010%), Burmese (95.4%, a difference of 0.010%), and Immigrants from Europe (95.4%, a difference of 0.020%).
| Demographics | Rating | Rank | 9th Grade |
| Immigrants | France | 97.4 /100 | #105 | Exceptional 95.5% |
| Immigrants | Norway | 97.1 /100 | #106 | Exceptional 95.5% |
| Immigrants | Zimbabwe | 96.9 /100 | #107 | Exceptional 95.5% |
| Chickasaw | 96.8 /100 | #108 | Exceptional 95.5% |
| Osage | 96.8 /100 | #109 | Exceptional 95.5% |
| Immigrants | Bulgaria | 96.7 /100 | #110 | Exceptional 95.5% |
| Cherokee | 96.3 /100 | #111 | Exceptional 95.4% |
| Immigrants | Croatia | 96.2 /100 | #112 | Exceptional 95.4% |
| Iroquois | 96.2 /100 | #113 | Exceptional 95.4% |
| German Russians | 96.1 /100 | #114 | Exceptional 95.4% |
| Burmese | 96.0 /100 | #115 | Exceptional 95.4% |
| Immigrants | Europe | 95.7 /100 | #116 | Exceptional 95.4% |
| Immigrants | Romania | 95.6 /100 | #117 | Exceptional 95.4% |
| Immigrants | Turkey | 95.6 /100 | #118 | Exceptional 95.4% |
| Soviet Union | 95.6 /100 | #119 | Exceptional 95.4% |