Northern European vs German Professional Degree

COMPARE

Northern European
Race
Ancestry
AfghanAfricanAlaska NativeAlaskan AthabascanAlbanianAleutAlsatianAmericanApacheArabArapahoArgentineanArmenianAssyrian/Chaldean/SyriacAustralianAustrianBahamianBangladeshiBarbadianBasqueBelgianBelizeanBermudanBhutaneseBlackfeetBolivianBrazilianBritishBritish West IndianBulgarianBurmeseCajunCambodianCanadianCape VerdeanCarpatho RusynCelticCentral AmericanCentral American IndianCherokeeCheyenneChickasawChileanChineseChippewaChoctawColombianColvilleComancheCosta RicanCreeCreekCroatianCrowCubanCypriotCzechCzechoslovakianDanishDelawareDominicanDutchDutch West IndianEastern EuropeanEcuadorianEgyptianEnglishEstonianEthiopianEuropeanFijianFilipinoFinnishFrenchFrench American IndianFrench CanadianGerman RussianGhanaianGreekGuamanian/ChamorroGuatemalanGuyaneseHaitianHmongHonduranHopiHoumaHungarianIcelanderIndian (Asian)IndonesianInupiatIranianIraqiIrishIroquoisIsraeliItalianJamaicanJapaneseJordanianKenyanKiowaKoreanLaotianLatvianLebaneseLiberianLithuanianLumbeeLuxembourgerMacedonianMalaysianMalteseMarshalleseMenomineeMexicanMexican American IndianMongolianMoroccanNative HawaiianNavajoNepaleseNew ZealanderNicaraguanNigerianNorthern EuropeanNorwegianOkinawanOsageOttawaPaiutePakistaniPalestinianPanamanianParaguayanPennsylvania GermanPeruvianPimaPolishPortuguesePotawatomiPuebloPuerto RicanPuget Sound SalishRomanianRussianSalvadoranSamoanScandinavianScotch-IrishScottishSeminoleSenegaleseSerbianShoshoneSierra LeoneanSiouxSlavicSlovakSloveneSomaliSouth AfricanSouth AmericanSouth American IndianSoviet UnionSpaniardSpanishSpanish AmericanSpanish American IndianSri LankanSubsaharan AfricanSudaneseSwedishSwissSyrianTaiwaneseThaiTlingit-HaidaTohono O'OdhamTonganTrinidadian and TobagonianTsimshianTurkishU.S. Virgin IslanderUgandanUkrainianUruguayanUteVenezuelanVietnameseWelshWest IndianYakamaYaquiYugoslavianYumanYup'ikZimbabwean
Immigration
NonimmigrantsImmigrantsAfghanistanAfricaAlbaniaArgentinaArmeniaAsiaAustraliaAustriaBahamasBangladeshBarbadosBelarusBelgiumBelizeBoliviaBosnia and HerzegovinaBrazilBulgariaBurma/MyanmarCabo VerdeCambodiaCameroonCanadaCaribbeanCentral AmericaChileChinaColombiaCongoCosta RicaCroatiaCubaCzechoslovakiaDenmarkDominicaDominican RepublicEastern AfricaEastern AsiaEastern EuropeEcuadorEgyptEl SalvadorEnglandEritreaEthiopiaEuropeFijiFranceGermanyGhanaGreeceGrenadaGuatemalaGuyanaHaitiHondurasHong KongHungaryIndiaIndonesiaIranIraqIrelandIsraelItalyJamaicaJapanJordanKazakhstanKenyaKoreaKuwaitLaosLatin AmericaLatviaLebanonLiberiaLithuaniaMalaysiaMexicoMicronesiaMiddle AfricaMoldovaMoroccoNepalNetherlandsNicaraguaNigeriaNorth AmericaNorth MacedoniaNorthern AfricaNorthern EuropeNorwayOceaniaPakistanPanamaPeruPhilippinesPolandPortugalRomaniaRussiaSaudi ArabiaScotlandSenegalSerbiaSierra LeoneSingaporeSomaliaSouth AfricaSouth AmericaSouth Central AsiaSouth Eastern AsiaSouthern EuropeSpainSri LankaSt. Vincent and the GrenadinesSudanSwedenSwitzerlandSyriaTaiwanThailandTrinidad and TobagoTurkeyUgandaUkraineUruguayUzbekistanVenezuelaVietnamWest IndiesWestern AfricaWestern AsiaWestern EuropeYemenZaireZimbabweAzores
German
Race
Ancestry
AfghanAfricanAlaska NativeAlaskan AthabascanAlbanianAleutAlsatianAmericanApacheArabArapahoArgentineanArmenianAssyrian/Chaldean/SyriacAustralianAustrianBahamianBangladeshiBarbadianBasqueBelgianBelizeanBermudanBhutaneseBlackfeetBolivianBrazilianBritishBritish West IndianBulgarianBurmeseCajunCambodianCanadianCape VerdeanCarpatho RusynCelticCentral AmericanCentral American IndianCherokeeCheyenneChickasawChileanChineseChippewaChoctawColombianColvilleComancheCosta RicanCreeCreekCroatianCrowCubanCypriotCzechCzechoslovakianDanishDelawareDominicanDutchDutch West IndianEastern EuropeanEcuadorianEgyptianEnglishEstonianEthiopianEuropeanFijianFilipinoFinnishFrenchFrench American IndianFrench CanadianGermanGerman RussianGhanaianGreekGuamanian/ChamorroGuatemalanGuyaneseHaitianHmongHonduranHopiHoumaHungarianIcelanderIndian (Asian)IndonesianInupiatIranianIraqiIrishIroquoisIsraeliItalianJamaicanJapaneseJordanianKenyanKiowaKoreanLaotianLatvianLebaneseLiberianLithuanianLumbeeLuxembourgerMacedonianMalaysianMalteseMarshalleseMenomineeMexicanMexican American IndianMongolianMoroccanNative HawaiianNavajoNepaleseNew ZealanderNicaraguanNigerianNorwegianOkinawanOsageOttawaPaiutePakistaniPalestinianPanamanianParaguayanPennsylvania GermanPeruvianPimaPolishPortuguesePotawatomiPuebloPuerto RicanPuget Sound SalishRomanianRussianSalvadoranSamoanScandinavianScotch-IrishScottishSeminoleSenegaleseSerbianShoshoneSierra LeoneanSiouxSlavicSlovakSloveneSomaliSouth AfricanSouth AmericanSouth American IndianSoviet UnionSpaniardSpanishSpanish AmericanSpanish American IndianSri LankanSubsaharan AfricanSudaneseSwedishSwissSyrianTaiwaneseThaiTlingit-HaidaTohono O'OdhamTonganTrinidadian and TobagonianTsimshianTurkishU.S. Virgin IslanderUgandanUkrainianUruguayanUteVenezuelanVietnameseWelshWest IndianYakamaYaquiYugoslavianYumanYup'ikZimbabwean
Immigration
NonimmigrantsImmigrantsAfghanistanAfricaAlbaniaArgentinaArmeniaAsiaAustraliaAustriaBahamasBangladeshBarbadosBelarusBelgiumBelizeBoliviaBosnia and HerzegovinaBrazilBulgariaBurma/MyanmarCabo VerdeCambodiaCameroonCanadaCaribbeanCentral AmericaChileChinaColombiaCongoCosta RicaCroatiaCubaCzechoslovakiaDenmarkDominicaDominican RepublicEastern AfricaEastern AsiaEastern EuropeEcuadorEgyptEl SalvadorEnglandEritreaEthiopiaEuropeFijiFranceGermanyGhanaGreeceGrenadaGuatemalaGuyanaHaitiHondurasHong KongHungaryIndiaIndonesiaIranIraqIrelandIsraelItalyJamaicaJapanJordanKazakhstanKenyaKoreaKuwaitLaosLatin AmericaLatviaLebanonLiberiaLithuaniaMalaysiaMexicoMicronesiaMiddle AfricaMoldovaMoroccoNepalNetherlandsNicaraguaNigeriaNorth AmericaNorth MacedoniaNorthern AfricaNorthern EuropeNorwayOceaniaPakistanPanamaPeruPhilippinesPolandPortugalRomaniaRussiaSaudi ArabiaScotlandSenegalSerbiaSierra LeoneSingaporeSomaliaSouth AfricaSouth AmericaSouth Central AsiaSouth Eastern AsiaSouthern EuropeSpainSri LankaSt. Vincent and the GrenadinesSudanSwedenSwitzerlandSyriaTaiwanThailandTrinidad and TobagoTurkeyUgandaUkraineUruguayUzbekistanVenezuelaVietnamWest IndiesWestern AfricaWestern AsiaWestern EuropeYemenZaireZimbabweAzores
Professional Degree
Income
Poverty
Unemployment
Labor Participation
Family Structure
Vehicle Availability
Education Level
Disability

Professional Degree Comparison

Northern Europeans

Germans

Exceptional
Poor
5.2%
PROFESSIONAL DEGREE
99.3/ 100
METRIC RATING
93rd/ 347
METRIC RANK
4.1%
PROFESSIONAL DEGREE
11.6/ 100
METRIC RATING
211th/ 347
METRIC RANK

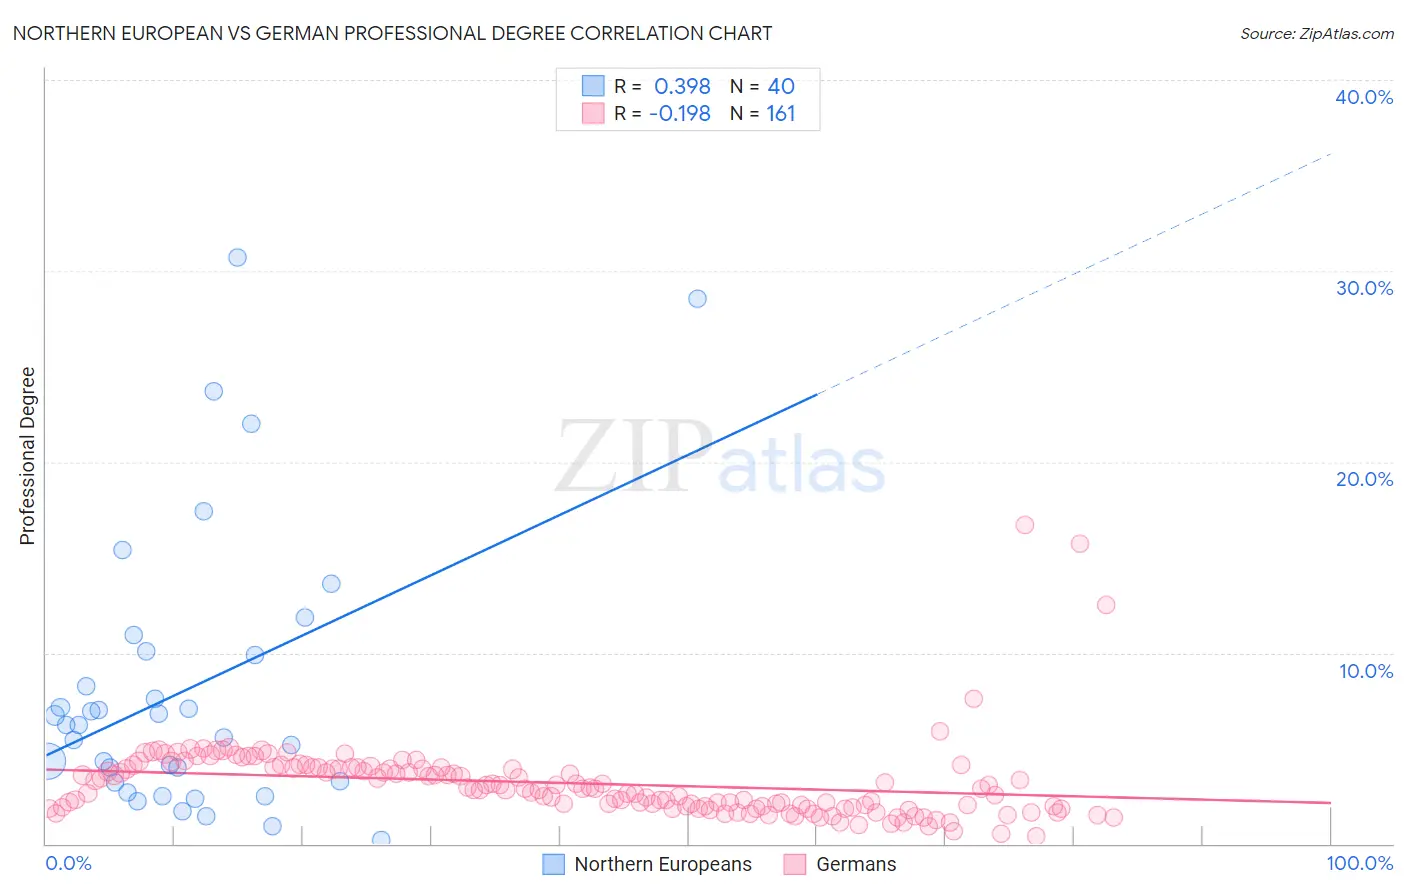
Northern European vs German Professional Degree Correlation Chart

The statistical analysis conducted on geographies consisting of 405,045,540 people shows a mild positive correlation between the proportion of Northern Europeans and percentage of population with at least professional degree education in the United States with a correlation coefficient (R) of 0.398 and weighted average of 5.2%. Similarly, the statistical analysis conducted on geographies consisting of 569,766,622 people shows a poor negative correlation between the proportion of Germans and percentage of population with at least professional degree education in the United States with a correlation coefficient (R) of -0.198 and weighted average of 4.1%, a difference of 27.6%.
Northern European vs German Professional Degree

Professional Degree Correlation Summary

MeasurementNorthern EuropeanGerman
Minimum0.22%0.41%
Maximum30.7%16.7%
Range30.5%16.3%
Mean8.1%3.2%
Median6.2%2.9%
Interquartile 25% (IQ1)3.2%1.9%
Interquartile 75% (IQ3)10.0%4.0%
Interquartile Range (IQR)6.7%2.1%
Standard Deviation (Sample)7.3%2.1%
Standard Deviation (Population)7.2%2.1%

Similar Demographics by Professional Degree

Demographics Similar to Northern Europeans by Professional Degree

In terms of professional degree, the demographic groups most similar to Northern Europeans are Alsatian (5.2%, a difference of 0.020%), Zimbabwean (5.2%, a difference of 0.20%), Immigrants from Uzbekistan (5.2%, a difference of 0.61%), Immigrants from Eastern Europe (5.2%, a difference of 0.65%), and Laotian (5.2%, a difference of 0.68%).
DemographicsRating | RankProfessional Degree
Greeks
99.6
/100
|
#86
Exceptional
5.3%
Immigrants | Chile
99.5
/100
|
#87
Exceptional
5.3%
Egyptians
99.5
/100
|
#88
Exceptional
5.3%
Chileans
99.5
/100
|
#89
Exceptional
5.3%
Immigrants | Scotland
99.5
/100
|
#90
Exceptional
5.3%
Laotians
99.5
/100
|
#91
Exceptional
5.2%
Immigrants | Eastern Europe
99.5
/100
|
#92
Exceptional
5.2%
Northern Europeans
99.3
/100
|
#93
Exceptional
5.2%
Alsatians
99.3
/100
|
#94
Exceptional
5.2%
Zimbabweans
99.3
/100
|
#95
Exceptional
5.2%
Immigrants | Uzbekistan
99.2
/100
|
#96
Exceptional
5.2%
Syrians
99.1
/100
|
#97
Exceptional
5.2%
Austrians
99.1
/100
|
#98
Exceptional
5.2%
Immigrants | Italy
99.1
/100
|
#99
Exceptional
5.2%
Ugandans
98.8
/100
|
#100
Exceptional
5.1%

Demographics Similar to Germans by Professional Degree

In terms of professional degree, the demographic groups most similar to Germans are Immigrants from Nigeria (4.1%, a difference of 0.030%), White/Caucasian (4.1%, a difference of 0.18%), Immigrants from Panama (4.1%, a difference of 0.26%), Immigrants from Somalia (4.1%, a difference of 0.33%), and Korean (4.1%, a difference of 0.36%).
DemographicsRating | RankProfessional Degree
Barbadians
15.8
/100
|
#204
Poor
4.1%
Somalis
14.8
/100
|
#205
Poor
4.1%
Yugoslavians
13.4
/100
|
#206
Poor
4.1%
Sub-Saharan Africans
12.8
/100
|
#207
Poor
4.1%
Immigrants | Somalia
12.5
/100
|
#208
Poor
4.1%
Immigrants | Panama
12.3
/100
|
#209
Poor
4.1%
Immigrants | Nigeria
11.7
/100
|
#210
Poor
4.1%
Germans
11.6
/100
|
#211
Poor
4.1%
Whites/Caucasians
11.2
/100
|
#212
Poor
4.1%
Koreans
10.7
/100
|
#213
Poor
4.1%
Immigrants | Ghana
10.6
/100
|
#214
Poor
4.1%
Portuguese
10.5
/100
|
#215
Poor
4.1%
West Indians
9.8
/100
|
#216
Tragic
4.1%
Immigrants | Vietnam
9.4
/100
|
#217
Tragic
4.0%
Dutch
9.0
/100
|
#218
Tragic
4.0%