Nonimmigrants vs Black/African American Master's Degree
COMPARE
Nonimmigrants
Black/African American
Master's Degree
Master's Degree Comparison
Nonimmigrants
Blacks/African Americans
13.3%
MASTER'S DEGREE
3.4/ 100
METRIC RATING
239th/ 347
METRIC RANK
12.1%
MASTER'S DEGREE
0.3/ 100
METRIC RATING
276th/ 347
METRIC RANK
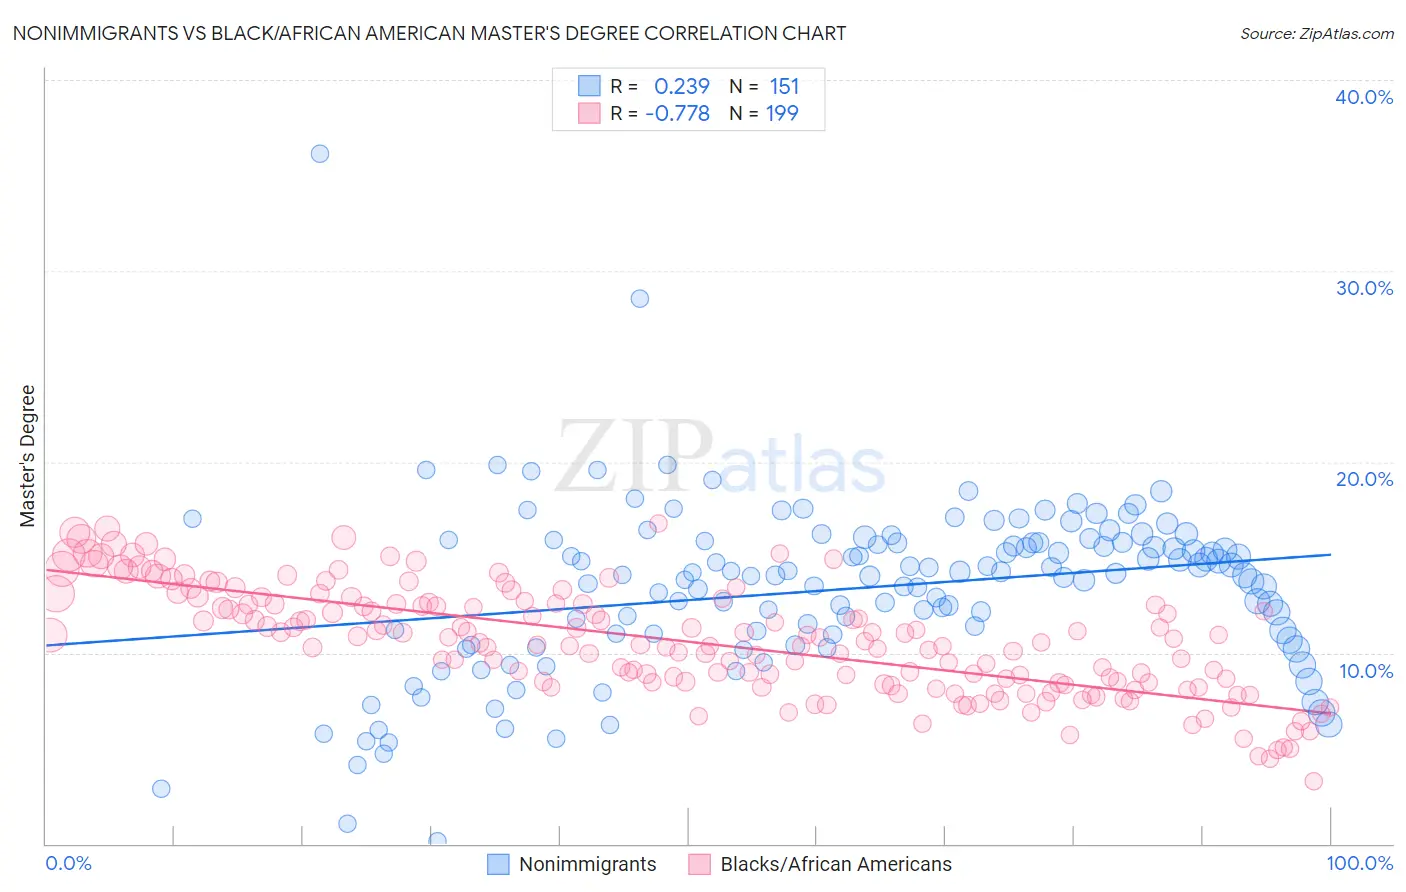
Nonimmigrants vs Black/African American Master's Degree Correlation Chart
The statistical analysis conducted on geographies consisting of 583,073,309 people shows a weak positive correlation between the proportion of Nonimmigrants and percentage of population with at least master's degree education in the United States with a correlation coefficient (R) of 0.239 and weighted average of 13.3%. Similarly, the statistical analysis conducted on geographies consisting of 563,961,779 people shows a strong negative correlation between the proportion of Blacks/African Americans and percentage of population with at least master's degree education in the United States with a correlation coefficient (R) of -0.778 and weighted average of 12.1%, a difference of 10.4%.
Master's Degree Correlation Summary
| Measurement | Nonimmigrants | Black/African American |
| Minimum | 0.15% | 3.3% |
| Maximum | 36.1% | 16.8% |
| Range | 36.0% | 13.5% |
| Mean | 13.3% | 10.6% |
| Median | 14.1% | 10.6% |
| Interquartile 25% (IQ1) | 11.0% | 8.4% |
| Interquartile 75% (IQ3) | 15.8% | 12.6% |
| Interquartile Range (IQR) | 4.8% | 4.1% |
| Standard Deviation (Sample) | 4.5% | 2.8% |
| Standard Deviation (Population) | 4.5% | 2.8% |
Similar Demographics by Master's Degree
Demographics Similar to Nonimmigrants by Master's Degree
In terms of master's degree, the demographic groups most similar to Nonimmigrants are Hmong (13.4%, a difference of 0.53%), Jamaican (13.4%, a difference of 0.67%), Immigrants from Guyana (13.4%, a difference of 0.89%), German Russian (13.5%, a difference of 1.0%), and Immigrants from Burma/Myanmar (13.5%, a difference of 1.4%).
| Demographics | Rating | Rank | Master's Degree |
| Immigrants | Philippines | 6.0 /100 | #232 | Tragic 13.6% |
| Immigrants | Ecuador | 5.7 /100 | #233 | Tragic 13.6% |
| Immigrants | Burma/Myanmar | 5.0 /100 | #234 | Tragic 13.5% |
| German Russians | 4.5 /100 | #235 | Tragic 13.5% |
| Immigrants | Guyana | 4.4 /100 | #236 | Tragic 13.4% |
| Jamaicans | 4.1 /100 | #237 | Tragic 13.4% |
| Hmong | 4.0 /100 | #238 | Tragic 13.4% |
| Immigrants | Nonimmigrants | 3.4 /100 | #239 | Tragic 13.3% |
| Guamanians/Chamorros | 2.2 /100 | #240 | Tragic 13.1% |
| U.S. Virgin Islanders | 2.1 /100 | #241 | Tragic 13.1% |
| Spanish Americans | 1.9 /100 | #242 | Tragic 13.0% |
| Immigrants | Jamaica | 1.9 /100 | #243 | Tragic 13.0% |
| Delaware | 1.7 /100 | #244 | Tragic 13.0% |
| Immigrants | Bahamas | 1.4 /100 | #245 | Tragic 12.9% |
| Immigrants | Cambodia | 1.4 /100 | #246 | Tragic 12.9% |
Demographics Similar to Blacks/African Americans by Master's Degree
In terms of master's degree, the demographic groups most similar to Blacks/African Americans are Immigrants from Caribbean (12.1%, a difference of 0.010%), Potawatomi (12.1%, a difference of 0.010%), Cuban (12.1%, a difference of 0.050%), Cape Verdean (12.1%, a difference of 0.070%), and Immigrants from Belize (12.1%, a difference of 0.090%).
| Demographics | Rating | Rank | Master's Degree |
| Central Americans | 0.3 /100 | #269 | Tragic 12.2% |
| Salvadorans | 0.3 /100 | #270 | Tragic 12.2% |
| Haitians | 0.3 /100 | #271 | Tragic 12.1% |
| Comanche | 0.3 /100 | #272 | Tragic 12.1% |
| Blackfeet | 0.3 /100 | #273 | Tragic 12.1% |
| Cape Verdeans | 0.3 /100 | #274 | Tragic 12.1% |
| Cubans | 0.3 /100 | #275 | Tragic 12.1% |
| Blacks/African Americans | 0.3 /100 | #276 | Tragic 12.1% |
| Immigrants | Caribbean | 0.3 /100 | #277 | Tragic 12.1% |
| Potawatomi | 0.3 /100 | #278 | Tragic 12.1% |
| Immigrants | Belize | 0.2 /100 | #279 | Tragic 12.1% |
| Immigrants | Dominican Republic | 0.2 /100 | #280 | Tragic 12.1% |
| Malaysians | 0.2 /100 | #281 | Tragic 12.0% |
| Immigrants | El Salvador | 0.2 /100 | #282 | Tragic 12.0% |
| Hondurans | 0.2 /100 | #283 | Tragic 11.9% |