Nonimmigrants vs Immigrants from Haiti Kindergarten
COMPARE
Nonimmigrants
Immigrants from Haiti
Kindergarten
Kindergarten Comparison
Nonimmigrants
Immigrants from Haiti
98.3%
KINDERGARTEN
98.3/ 100
METRIC RATING
96th/ 347
METRIC RANK
97.0%
KINDERGARTEN
0.0/ 100
METRIC RATING
309th/ 347
METRIC RANK
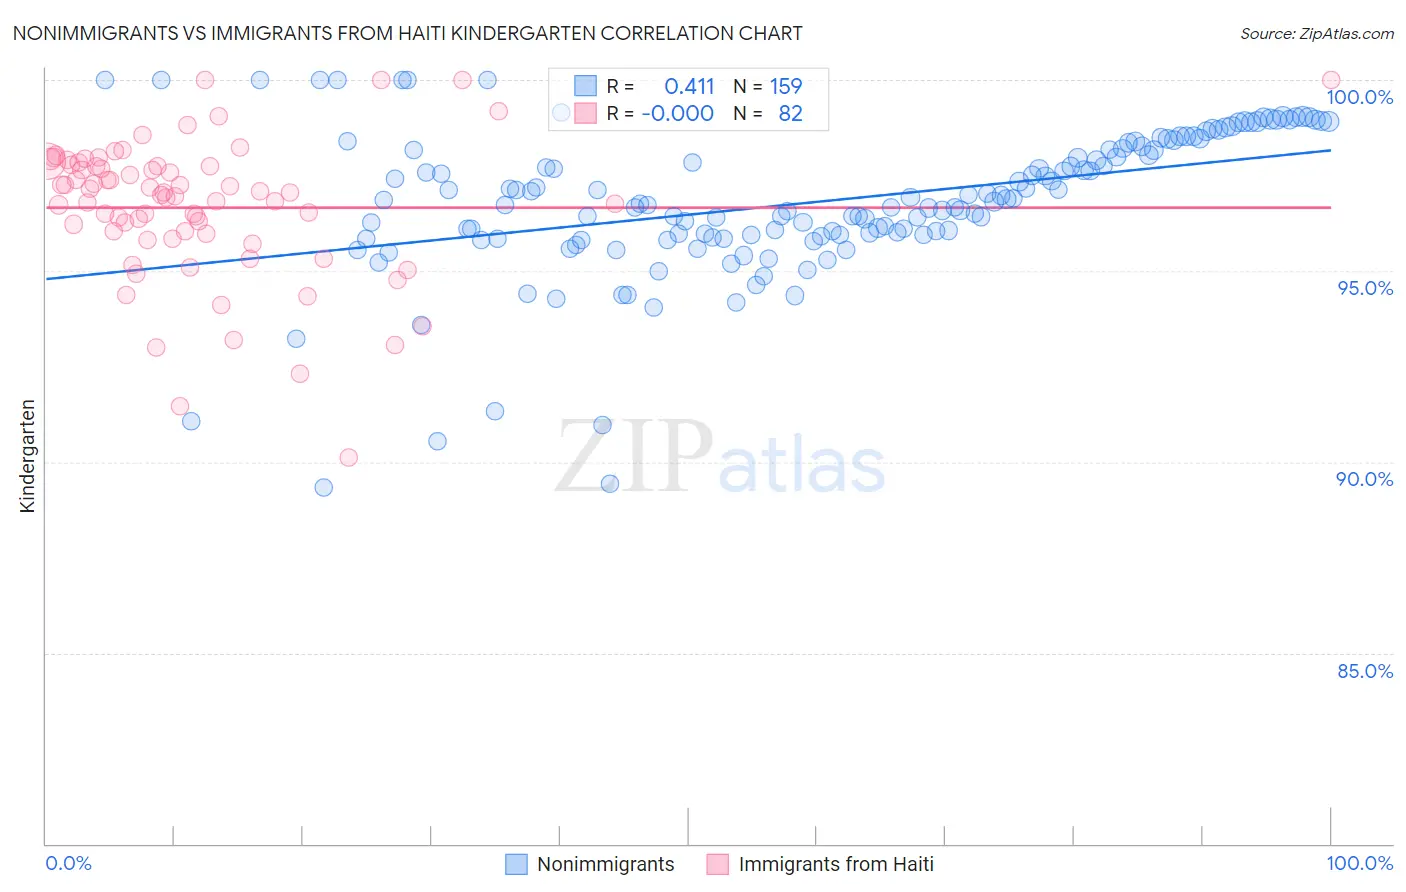
Nonimmigrants vs Immigrants from Haiti Kindergarten Correlation Chart
The statistical analysis conducted on geographies consisting of 585,374,774 people shows a moderate positive correlation between the proportion of Nonimmigrants and percentage of population with at least kindergarten education in the United States with a correlation coefficient (R) of 0.411 and weighted average of 98.3%. Similarly, the statistical analysis conducted on geographies consisting of 225,286,614 people shows no correlation between the proportion of Immigrants from Haiti and percentage of population with at least kindergarten education in the United States with a correlation coefficient (R) of -0.000 and weighted average of 97.0%, a difference of 1.3%.
Kindergarten Correlation Summary
| Measurement | Nonimmigrants | Immigrants from Haiti |
| Minimum | 89.3% | 90.1% |
| Maximum | 100.0% | 100.0% |
| Range | 10.7% | 9.9% |
| Mean | 96.8% | 96.7% |
| Median | 96.8% | 97.0% |
| Interquartile 25% (IQ1) | 95.9% | 96.0% |
| Interquartile 75% (IQ3) | 98.3% | 97.8% |
| Interquartile Range (IQR) | 2.4% | 1.8% |
| Standard Deviation (Sample) | 1.9% | 1.8% |
| Standard Deviation (Population) | 1.9% | 1.8% |
Similar Demographics by Kindergarten
Demographics Similar to Nonimmigrants by Kindergarten
In terms of kindergarten, the demographic groups most similar to Nonimmigrants are Cypriot (98.3%, a difference of 0.0%), Choctaw (98.3%, a difference of 0.0%), Colville (98.3%, a difference of 0.0%), South African (98.3%, a difference of 0.010%), and Immigrants from Germany (98.3%, a difference of 0.010%).
| Demographics | Rating | Rank | Kindergarten |
| Immigrants | South Africa | 98.8 /100 | #89 | Exceptional 98.3% |
| Zimbabweans | 98.8 /100 | #90 | Exceptional 98.3% |
| Immigrants | Western Europe | 98.8 /100 | #91 | Exceptional 98.3% |
| Macedonians | 98.7 /100 | #92 | Exceptional 98.3% |
| Immigrants | India | 98.6 /100 | #93 | Exceptional 98.3% |
| South Africans | 98.5 /100 | #94 | Exceptional 98.3% |
| Immigrants | Germany | 98.5 /100 | #95 | Exceptional 98.3% |
| Immigrants | Nonimmigrants | 98.3 /100 | #96 | Exceptional 98.3% |
| Cypriots | 98.3 /100 | #97 | Exceptional 98.3% |
| Choctaw | 98.2 /100 | #98 | Exceptional 98.3% |
| Colville | 98.2 /100 | #99 | Exceptional 98.3% |
| Puget Sound Salish | 98.1 /100 | #100 | Exceptional 98.2% |
| Romanians | 97.8 /100 | #101 | Exceptional 98.2% |
| Cree | 97.7 /100 | #102 | Exceptional 98.2% |
| Immigrants | Ireland | 97.6 /100 | #103 | Exceptional 98.2% |
Demographics Similar to Immigrants from Haiti by Kindergarten
In terms of kindergarten, the demographic groups most similar to Immigrants from Haiti are Immigrants from Somalia (97.0%, a difference of 0.0%), Immigrants from the Azores (97.0%, a difference of 0.0%), Hispanic or Latino (97.0%, a difference of 0.010%), Sri Lankan (97.0%, a difference of 0.010%), and Belizean (97.0%, a difference of 0.020%).
| Demographics | Rating | Rank | Kindergarten |
| Immigrants | Caribbean | 0.0 /100 | #302 | Tragic 97.1% |
| Somalis | 0.0 /100 | #303 | Tragic 97.0% |
| Nicaraguans | 0.0 /100 | #304 | Tragic 97.0% |
| Ecuadorians | 0.0 /100 | #305 | Tragic 97.0% |
| Belizeans | 0.0 /100 | #306 | Tragic 97.0% |
| Hispanics or Latinos | 0.0 /100 | #307 | Tragic 97.0% |
| Immigrants | Somalia | 0.0 /100 | #308 | Tragic 97.0% |
| Immigrants | Haiti | 0.0 /100 | #309 | Tragic 97.0% |
| Immigrants | Azores | 0.0 /100 | #310 | Tragic 97.0% |
| Sri Lankans | 0.0 /100 | #311 | Tragic 97.0% |
| Guyanese | 0.0 /100 | #312 | Tragic 96.9% |
| Cape Verdeans | 0.0 /100 | #313 | Tragic 96.9% |
| Hondurans | 0.0 /100 | #314 | Tragic 96.9% |
| Immigrants | Belize | 0.0 /100 | #315 | Tragic 96.9% |
| Immigrants | Nicaragua | 0.0 /100 | #316 | Tragic 96.9% |