Nonimmigrants vs British Kindergarten
COMPARE
Nonimmigrants
British
Kindergarten
Kindergarten Comparison
Nonimmigrants
British
98.3%
KINDERGARTEN
98.3/ 100
METRIC RATING
96th/ 347
METRIC RANK
98.5%
KINDERGARTEN
99.9/ 100
METRIC RATING
36th/ 347
METRIC RANK
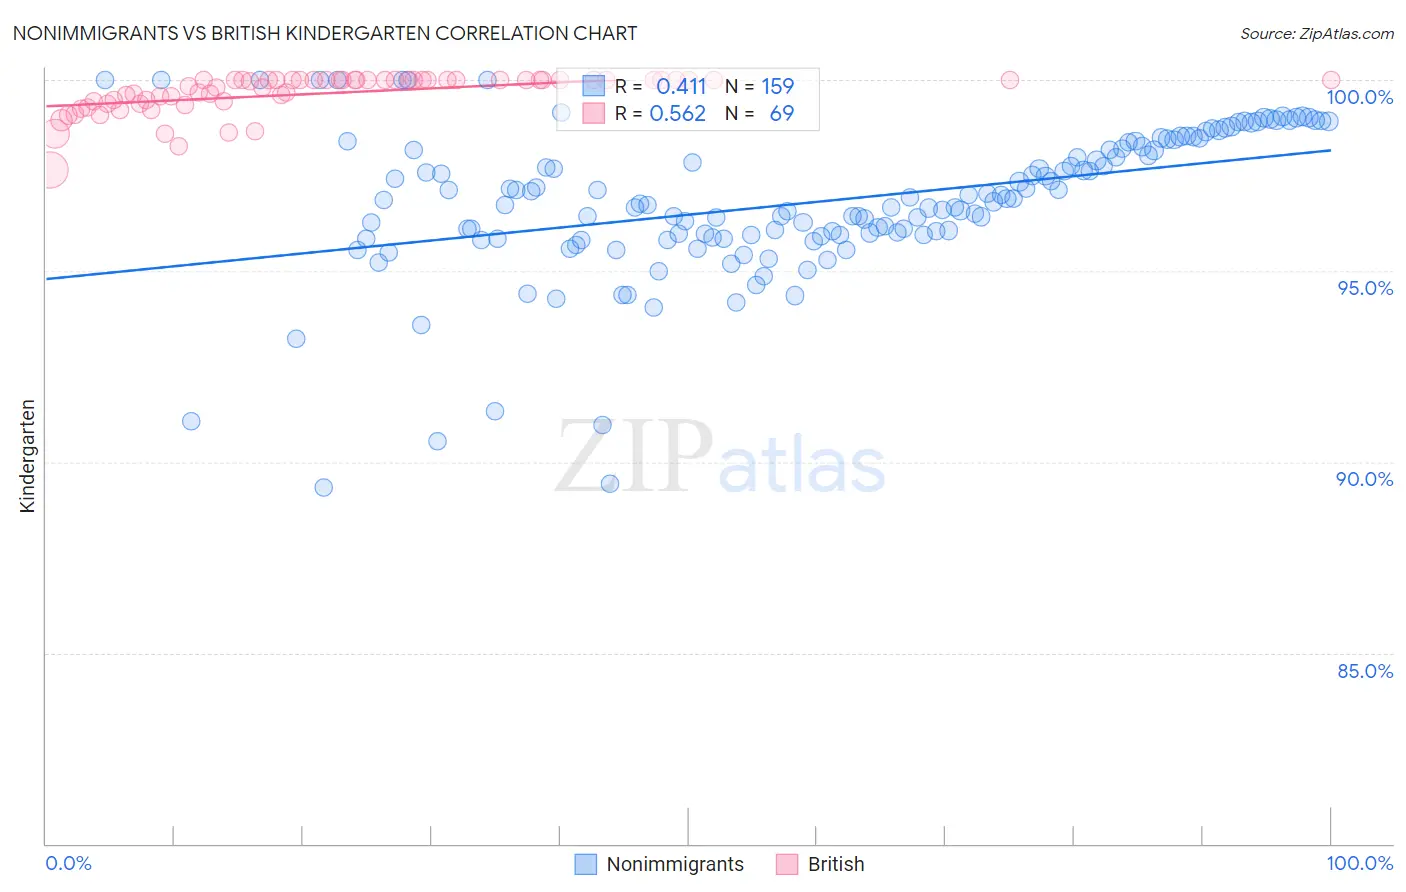
Nonimmigrants vs British Kindergarten Correlation Chart
The statistical analysis conducted on geographies consisting of 585,374,774 people shows a moderate positive correlation between the proportion of Nonimmigrants and percentage of population with at least kindergarten education in the United States with a correlation coefficient (R) of 0.411 and weighted average of 98.3%. Similarly, the statistical analysis conducted on geographies consisting of 531,462,526 people shows a substantial positive correlation between the proportion of British and percentage of population with at least kindergarten education in the United States with a correlation coefficient (R) of 0.562 and weighted average of 98.5%, a difference of 0.27%.
Kindergarten Correlation Summary
| Measurement | Nonimmigrants | British |
| Minimum | 89.3% | 97.6% |
| Maximum | 100.0% | 100.0% |
| Range | 10.7% | 2.4% |
| Mean | 96.8% | 99.6% |
| Median | 96.8% | 100.0% |
| Interquartile 25% (IQ1) | 95.9% | 99.4% |
| Interquartile 75% (IQ3) | 98.3% | 100.0% |
| Interquartile Range (IQR) | 2.4% | 0.59% |
| Standard Deviation (Sample) | 1.9% | 0.51% |
| Standard Deviation (Population) | 1.9% | 0.50% |
Similar Demographics by Kindergarten
Demographics Similar to Nonimmigrants by Kindergarten
In terms of kindergarten, the demographic groups most similar to Nonimmigrants are Cypriot (98.3%, a difference of 0.0%), Choctaw (98.3%, a difference of 0.0%), Colville (98.3%, a difference of 0.0%), South African (98.3%, a difference of 0.010%), and Immigrants from Germany (98.3%, a difference of 0.010%).
| Demographics | Rating | Rank | Kindergarten |
| Immigrants | South Africa | 98.8 /100 | #89 | Exceptional 98.3% |
| Zimbabweans | 98.8 /100 | #90 | Exceptional 98.3% |
| Immigrants | Western Europe | 98.8 /100 | #91 | Exceptional 98.3% |
| Macedonians | 98.7 /100 | #92 | Exceptional 98.3% |
| Immigrants | India | 98.6 /100 | #93 | Exceptional 98.3% |
| South Africans | 98.5 /100 | #94 | Exceptional 98.3% |
| Immigrants | Germany | 98.5 /100 | #95 | Exceptional 98.3% |
| Immigrants | Nonimmigrants | 98.3 /100 | #96 | Exceptional 98.3% |
| Cypriots | 98.3 /100 | #97 | Exceptional 98.3% |
| Choctaw | 98.2 /100 | #98 | Exceptional 98.3% |
| Colville | 98.2 /100 | #99 | Exceptional 98.3% |
| Puget Sound Salish | 98.1 /100 | #100 | Exceptional 98.2% |
| Romanians | 97.8 /100 | #101 | Exceptional 98.2% |
| Cree | 97.7 /100 | #102 | Exceptional 98.2% |
| Immigrants | Ireland | 97.6 /100 | #103 | Exceptional 98.2% |
Demographics Similar to British by Kindergarten
In terms of kindergarten, the demographic groups most similar to British are Chinese (98.5%, a difference of 0.020%), Swiss (98.5%, a difference of 0.020%), Italian (98.5%, a difference of 0.020%), Latvian (98.5%, a difference of 0.020%), and Chippewa (98.5%, a difference of 0.030%).
| Demographics | Rating | Rank | Kindergarten |
| French | 100.0 /100 | #29 | Exceptional 98.6% |
| Europeans | 100.0 /100 | #30 | Exceptional 98.6% |
| Czechs | 100.0 /100 | #31 | Exceptional 98.6% |
| French Canadians | 100.0 /100 | #32 | Exceptional 98.6% |
| Scandinavians | 100.0 /100 | #33 | Exceptional 98.6% |
| Chinese | 100.0 /100 | #34 | Exceptional 98.5% |
| Swiss | 100.0 /100 | #35 | Exceptional 98.5% |
| British | 99.9 /100 | #36 | Exceptional 98.5% |
| Italians | 99.9 /100 | #37 | Exceptional 98.5% |
| Latvians | 99.9 /100 | #38 | Exceptional 98.5% |
| Chippewa | 99.9 /100 | #39 | Exceptional 98.5% |
| Luxembourgers | 99.9 /100 | #40 | Exceptional 98.5% |
| Eastern Europeans | 99.9 /100 | #41 | Exceptional 98.5% |
| Native Hawaiians | 99.9 /100 | #42 | Exceptional 98.5% |
| Lumbee | 99.9 /100 | #43 | Exceptional 98.5% |