Nonimmigrants vs Immigrants from Netherlands Professional Degree
COMPARE
Nonimmigrants
Immigrants from Netherlands
Professional Degree
Professional Degree Comparison
Nonimmigrants
Immigrants from Netherlands
3.9%
PROFESSIONAL DEGREE
4.0/ 100
METRIC RATING
234th/ 347
METRIC RANK
5.8%
PROFESSIONAL DEGREE
100.0/ 100
METRIC RATING
53rd/ 347
METRIC RANK
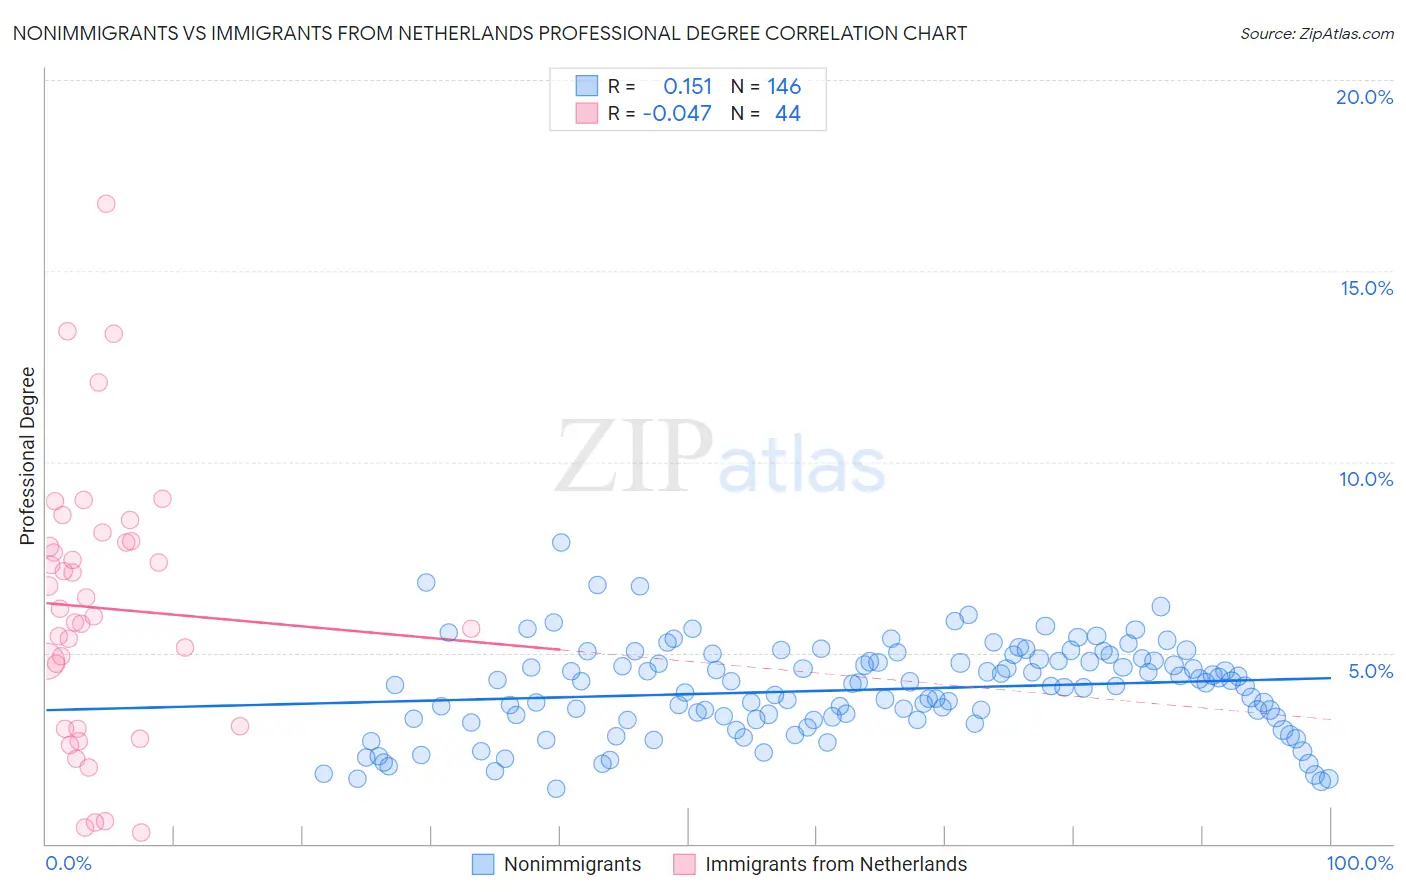
Nonimmigrants vs Immigrants from Netherlands Professional Degree Correlation Chart
The statistical analysis conducted on geographies consisting of 572,440,292 people shows a poor positive correlation between the proportion of Nonimmigrants and percentage of population with at least professional degree education in the United States with a correlation coefficient (R) of 0.151 and weighted average of 3.9%. Similarly, the statistical analysis conducted on geographies consisting of 237,680,329 people shows no correlation between the proportion of Immigrants from Netherlands and percentage of population with at least professional degree education in the United States with a correlation coefficient (R) of -0.047 and weighted average of 5.8%, a difference of 48.7%.
Professional Degree Correlation Summary
| Measurement | Nonimmigrants | Immigrants from Netherlands |
| Minimum | 1.4% | 0.31% |
| Maximum | 7.9% | 16.8% |
| Range | 6.4% | 16.4% |
| Mean | 4.0% | 6.2% |
| Median | 4.1% | 6.1% |
| Interquartile 25% (IQ1) | 3.3% | 3.1% |
| Interquartile 75% (IQ3) | 4.8% | 7.9% |
| Interquartile Range (IQR) | 1.5% | 4.8% |
| Standard Deviation (Sample) | 1.2% | 3.6% |
| Standard Deviation (Population) | 1.2% | 3.5% |
Similar Demographics by Professional Degree
Demographics Similar to Nonimmigrants by Professional Degree
In terms of professional degree, the demographic groups most similar to Nonimmigrants are Immigrants from Barbados (3.9%, a difference of 0.010%), Immigrants from Philippines (3.9%, a difference of 0.050%), Spanish American (3.9%, a difference of 0.23%), Cree (3.9%, a difference of 0.30%), and Immigrants from Trinidad and Tobago (3.9%, a difference of 0.30%).
| Demographics | Rating | Rank | Professional Degree |
| Cubans | 5.9 /100 | #227 | Tragic 4.0% |
| Immigrants | West Indies | 5.6 /100 | #228 | Tragic 4.0% |
| Immigrants | Burma/Myanmar | 5.4 /100 | #229 | Tragic 3.9% |
| Nicaraguans | 5.1 /100 | #230 | Tragic 3.9% |
| Ecuadorians | 4.6 /100 | #231 | Tragic 3.9% |
| Cree | 4.3 /100 | #232 | Tragic 3.9% |
| Immigrants | Philippines | 4.1 /100 | #233 | Tragic 3.9% |
| Immigrants | Nonimmigrants | 4.0 /100 | #234 | Tragic 3.9% |
| Immigrants | Barbados | 4.0 /100 | #235 | Tragic 3.9% |
| Spanish Americans | 3.8 /100 | #236 | Tragic 3.9% |
| Immigrants | Trinidad and Tobago | 3.8 /100 | #237 | Tragic 3.9% |
| Colville | 2.6 /100 | #238 | Tragic 3.8% |
| British West Indians | 2.4 /100 | #239 | Tragic 3.8% |
| Immigrants | Ecuador | 2.3 /100 | #240 | Tragic 3.8% |
| Alaskan Athabascans | 2.3 /100 | #241 | Tragic 3.8% |
Demographics Similar to Immigrants from Netherlands by Professional Degree
In terms of professional degree, the demographic groups most similar to Immigrants from Netherlands are Immigrants from Serbia (5.8%, a difference of 0.23%), Immigrants from Greece (5.8%, a difference of 0.30%), Immigrants from Czechoslovakia (5.8%, a difference of 0.36%), Immigrants from Latvia (5.8%, a difference of 0.68%), and Immigrants from Kuwait (5.7%, a difference of 1.0%).
| Demographics | Rating | Rank | Professional Degree |
| Immigrants | Argentina | 100.0 /100 | #46 | Exceptional 5.9% |
| Australians | 100.0 /100 | #47 | Exceptional 5.9% |
| Paraguayans | 100.0 /100 | #48 | Exceptional 5.9% |
| Immigrants | Latvia | 100.0 /100 | #49 | Exceptional 5.8% |
| Immigrants | Czechoslovakia | 100.0 /100 | #50 | Exceptional 5.8% |
| Immigrants | Greece | 100.0 /100 | #51 | Exceptional 5.8% |
| Immigrants | Serbia | 100.0 /100 | #52 | Exceptional 5.8% |
| Immigrants | Netherlands | 100.0 /100 | #53 | Exceptional 5.8% |
| Immigrants | Kuwait | 100.0 /100 | #54 | Exceptional 5.7% |
| Immigrants | Western Europe | 100.0 /100 | #55 | Exceptional 5.7% |
| Immigrants | Malaysia | 100.0 /100 | #56 | Exceptional 5.7% |
| South Africans | 100.0 /100 | #57 | Exceptional 5.7% |
| Bulgarians | 100.0 /100 | #58 | Exceptional 5.7% |
| Immigrants | Europe | 100.0 /100 | #59 | Exceptional 5.6% |
| Bolivians | 99.9 /100 | #60 | Exceptional 5.6% |