Nigerian vs Seminole Bachelor's Degree
COMPARE
Nigerian
Seminole
Bachelor's Degree
Bachelor's Degree Comparison
Nigerians
Seminole
37.2%
BACHELOR'S DEGREE
33.9/ 100
METRIC RATING
191st/ 347
METRIC RANK
29.4%
BACHELOR'S DEGREE
0.0/ 100
METRIC RATING
312th/ 347
METRIC RANK
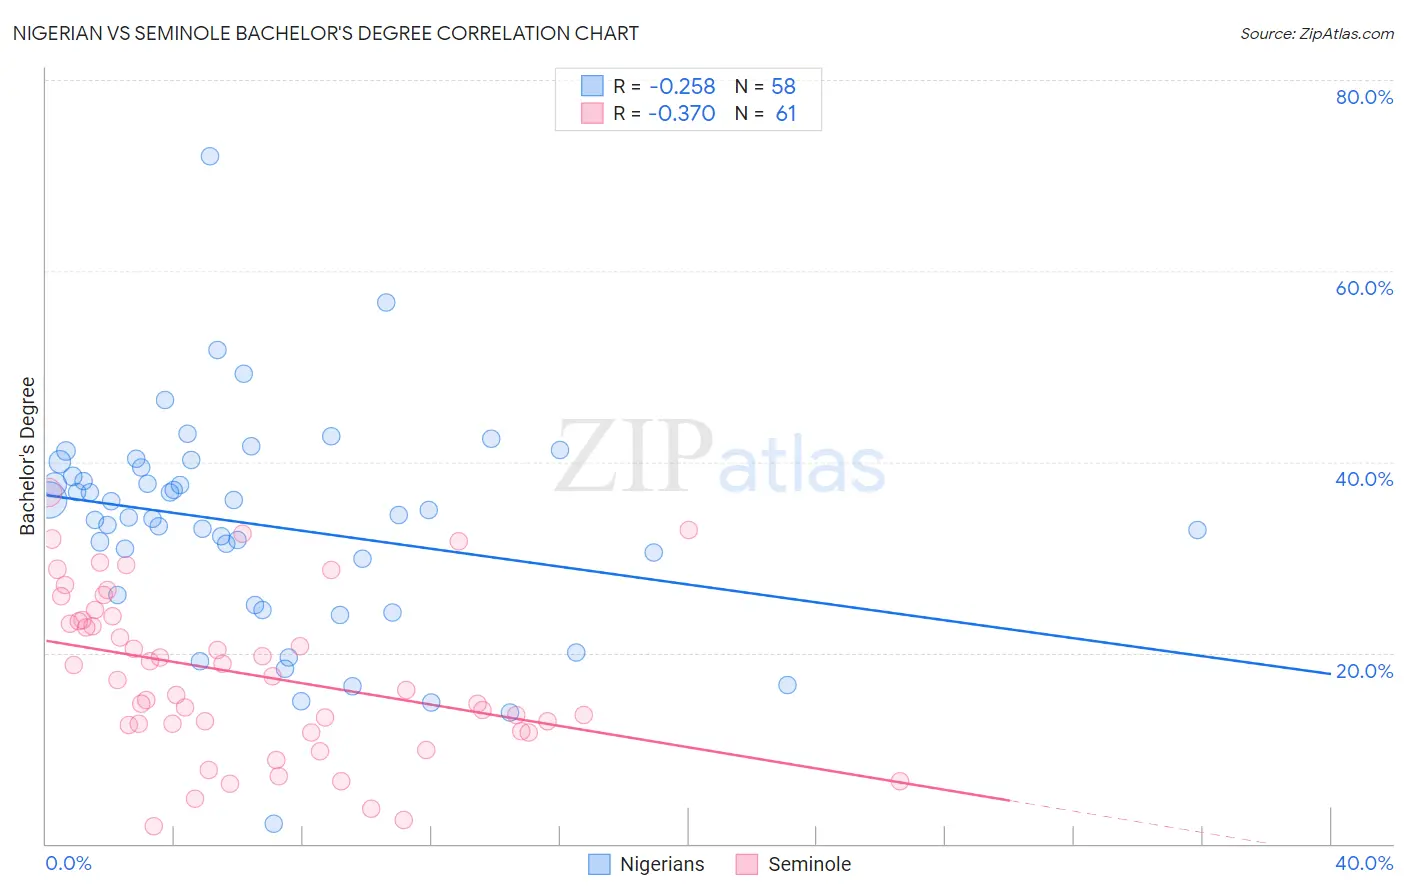
Nigerian vs Seminole Bachelor's Degree Correlation Chart
The statistical analysis conducted on geographies consisting of 332,744,449 people shows a weak negative correlation between the proportion of Nigerians and percentage of population with at least bachelor's degree education in the United States with a correlation coefficient (R) of -0.258 and weighted average of 37.2%. Similarly, the statistical analysis conducted on geographies consisting of 118,312,408 people shows a mild negative correlation between the proportion of Seminole and percentage of population with at least bachelor's degree education in the United States with a correlation coefficient (R) of -0.370 and weighted average of 29.4%, a difference of 26.5%.
Bachelor's Degree Correlation Summary
| Measurement | Nigerian | Seminole |
| Minimum | 2.0% | 1.9% |
| Maximum | 72.0% | 36.8% |
| Range | 70.0% | 34.9% |
| Mean | 33.4% | 17.7% |
| Median | 34.3% | 17.1% |
| Interquartile 25% (IQ1) | 26.1% | 12.1% |
| Interquartile 75% (IQ3) | 39.4% | 23.6% |
| Interquartile Range (IQR) | 13.3% | 11.6% |
| Standard Deviation (Sample) | 11.4% | 8.5% |
| Standard Deviation (Population) | 11.3% | 8.4% |
Similar Demographics by Bachelor's Degree
Demographics Similar to Nigerians by Bachelor's Degree
In terms of bachelor's degree, the demographic groups most similar to Nigerians are Swiss (37.2%, a difference of 0.020%), Immigrants from Vietnam (37.1%, a difference of 0.20%), Yugoslavian (37.1%, a difference of 0.27%), Slovak (37.3%, a difference of 0.32%), and Immigrants from Oceania (37.3%, a difference of 0.37%).
| Demographics | Rating | Rank | Bachelor's Degree |
| Scandinavians | 41.7 /100 | #184 | Average 37.5% |
| Immigrants | Peru | 41.3 /100 | #185 | Average 37.5% |
| Norwegians | 40.4 /100 | #186 | Average 37.5% |
| English | 39.7 /100 | #187 | Fair 37.4% |
| Immigrants | Oceania | 37.3 /100 | #188 | Fair 37.3% |
| Slovaks | 36.9 /100 | #189 | Fair 37.3% |
| Swiss | 34.1 /100 | #190 | Fair 37.2% |
| Nigerians | 33.9 /100 | #191 | Fair 37.2% |
| Immigrants | Vietnam | 32.1 /100 | #192 | Fair 37.1% |
| Yugoslavians | 31.5 /100 | #193 | Fair 37.1% |
| Belgians | 29.9 /100 | #194 | Fair 37.0% |
| Koreans | 29.8 /100 | #195 | Fair 37.0% |
| Celtics | 29.5 /100 | #196 | Fair 37.0% |
| Czechoslovakians | 29.2 /100 | #197 | Fair 37.0% |
| Welsh | 29.1 /100 | #198 | Fair 37.0% |
Demographics Similar to Seminole by Bachelor's Degree
In terms of bachelor's degree, the demographic groups most similar to Seminole are Choctaw (29.4%, a difference of 0.060%), Cheyenne (29.4%, a difference of 0.13%), Alaska Native (29.4%, a difference of 0.18%), Shoshone (29.3%, a difference of 0.48%), and Immigrants from Cabo Verde (29.2%, a difference of 0.56%).
| Demographics | Rating | Rank | Bachelor's Degree |
| Immigrants | Latin America | 0.0 /100 | #305 | Tragic 30.1% |
| Immigrants | Yemen | 0.0 /100 | #306 | Tragic 29.9% |
| Nepalese | 0.0 /100 | #307 | Tragic 29.9% |
| Cajuns | 0.0 /100 | #308 | Tragic 29.6% |
| Hispanics or Latinos | 0.0 /100 | #309 | Tragic 29.6% |
| Cheyenne | 0.0 /100 | #310 | Tragic 29.4% |
| Choctaw | 0.0 /100 | #311 | Tragic 29.4% |
| Seminole | 0.0 /100 | #312 | Tragic 29.4% |
| Alaska Natives | 0.0 /100 | #313 | Tragic 29.4% |
| Shoshone | 0.0 /100 | #314 | Tragic 29.3% |
| Immigrants | Cabo Verde | 0.0 /100 | #315 | Tragic 29.2% |
| Sioux | 0.0 /100 | #316 | Tragic 29.1% |
| Colville | 0.0 /100 | #317 | Tragic 29.0% |
| Yaqui | 0.0 /100 | #318 | Tragic 29.0% |
| Creek | 0.0 /100 | #319 | Tragic 28.9% |