Nigerian vs Cree 6th Grade
COMPARE
Nigerian
Cree
6th Grade
6th Grade Comparison
Nigerians
Cree
96.6%
6TH GRADE
1.9/ 100
METRIC RATING
238th/ 347
METRIC RANK
97.5%
6TH GRADE
98.7/ 100
METRIC RATING
93rd/ 347
METRIC RANK
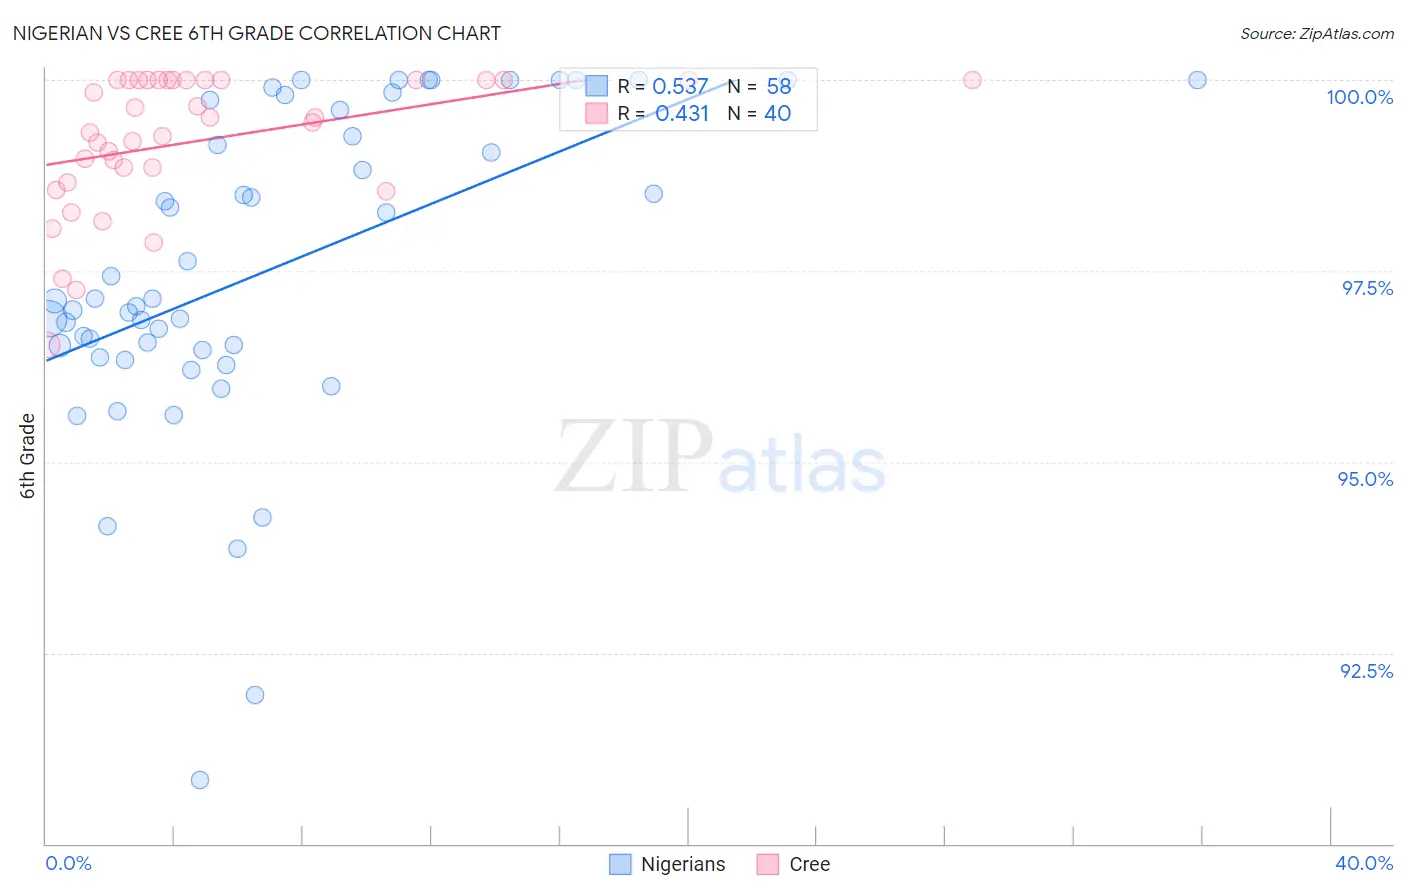
Nigerian vs Cree 6th Grade Correlation Chart
The statistical analysis conducted on geographies consisting of 332,724,627 people shows a substantial positive correlation between the proportion of Nigerians and percentage of population with at least 6th grade education in the United States with a correlation coefficient (R) of 0.537 and weighted average of 96.6%. Similarly, the statistical analysis conducted on geographies consisting of 76,204,399 people shows a moderate positive correlation between the proportion of Cree and percentage of population with at least 6th grade education in the United States with a correlation coefficient (R) of 0.431 and weighted average of 97.5%, a difference of 0.95%.
6th Grade Correlation Summary
| Measurement | Nigerian | Cree |
| Minimum | 90.8% | 96.5% |
| Maximum | 100.0% | 100.0% |
| Range | 9.2% | 3.5% |
| Mean | 97.5% | 99.2% |
| Median | 97.1% | 99.5% |
| Interquartile 25% (IQ1) | 96.5% | 98.8% |
| Interquartile 75% (IQ3) | 99.6% | 100.0% |
| Interquartile Range (IQR) | 3.1% | 1.2% |
| Standard Deviation (Sample) | 2.1% | 0.90% |
| Standard Deviation (Population) | 2.0% | 0.89% |
Similar Demographics by 6th Grade
Demographics Similar to Nigerians by 6th Grade
In terms of 6th grade, the demographic groups most similar to Nigerians are Indian (Asian) (96.6%, a difference of 0.0%), Korean (96.6%, a difference of 0.0%), Senegalese (96.6%, a difference of 0.0%), Immigrants from Eastern Africa (96.6%, a difference of 0.010%), and Immigrants from Asia (96.6%, a difference of 0.010%).
| Demographics | Rating | Rank | 6th Grade |
| Sub-Saharan Africans | 3.5 /100 | #231 | Tragic 96.7% |
| South American Indians | 3.5 /100 | #232 | Tragic 96.7% |
| Yuman | 3.2 /100 | #233 | Tragic 96.7% |
| Uruguayans | 2.5 /100 | #234 | Tragic 96.6% |
| Asians | 2.4 /100 | #235 | Tragic 96.6% |
| Immigrants | Indonesia | 2.3 /100 | #236 | Tragic 96.6% |
| Immigrants | Eastern Africa | 2.0 /100 | #237 | Tragic 96.6% |
| Nigerians | 1.9 /100 | #238 | Tragic 96.6% |
| Indians (Asian) | 1.9 /100 | #239 | Tragic 96.6% |
| Koreans | 1.9 /100 | #240 | Tragic 96.6% |
| Senegalese | 1.8 /100 | #241 | Tragic 96.6% |
| Immigrants | Asia | 1.8 /100 | #242 | Tragic 96.6% |
| Immigrants | Liberia | 1.6 /100 | #243 | Tragic 96.6% |
| Ethiopians | 1.5 /100 | #244 | Tragic 96.6% |
| Immigrants | Costa Rica | 1.3 /100 | #245 | Tragic 96.6% |
Demographics Similar to Cree by 6th Grade
In terms of 6th grade, the demographic groups most similar to Cree are Romanian (97.5%, a difference of 0.0%), Cypriot (97.5%, a difference of 0.0%), Immigrants from Ireland (97.5%, a difference of 0.0%), Immigrants from Germany (97.5%, a difference of 0.0%), and Immigrants from Sweden (97.5%, a difference of 0.0%).
| Demographics | Rating | Rank | 6th Grade |
| Immigrants | Belgium | 98.9 /100 | #86 | Exceptional 97.5% |
| Puget Sound Salish | 98.9 /100 | #87 | Exceptional 97.5% |
| Immigrants | South Africa | 98.9 /100 | #88 | Exceptional 97.5% |
| Immigrants | Australia | 98.8 /100 | #89 | Exceptional 97.5% |
| Pueblo | 98.8 /100 | #90 | Exceptional 97.5% |
| Immigrants | Western Europe | 98.8 /100 | #91 | Exceptional 97.5% |
| Romanians | 98.7 /100 | #92 | Exceptional 97.5% |
| Cree | 98.7 /100 | #93 | Exceptional 97.5% |
| Cypriots | 98.7 /100 | #94 | Exceptional 97.5% |
| Immigrants | Ireland | 98.7 /100 | #95 | Exceptional 97.5% |
| Immigrants | Germany | 98.6 /100 | #96 | Exceptional 97.5% |
| Immigrants | Sweden | 98.6 /100 | #97 | Exceptional 97.5% |
| Immigrants | Denmark | 98.5 /100 | #98 | Exceptional 97.5% |
| Yugoslavians | 98.5 /100 | #99 | Exceptional 97.5% |
| Turks | 98.3 /100 | #100 | Exceptional 97.5% |