Nigerian vs Immigrants from Hong Kong 3rd Grade
COMPARE
Nigerian
Immigrants from Hong Kong
3rd Grade
3rd Grade Comparison
Nigerians
Immigrants from Hong Kong
97.4%
3RD GRADE
1.6/ 100
METRIC RATING
239th/ 347
METRIC RANK
97.1%
3RD GRADE
0.0/ 100
METRIC RATING
285th/ 347
METRIC RANK
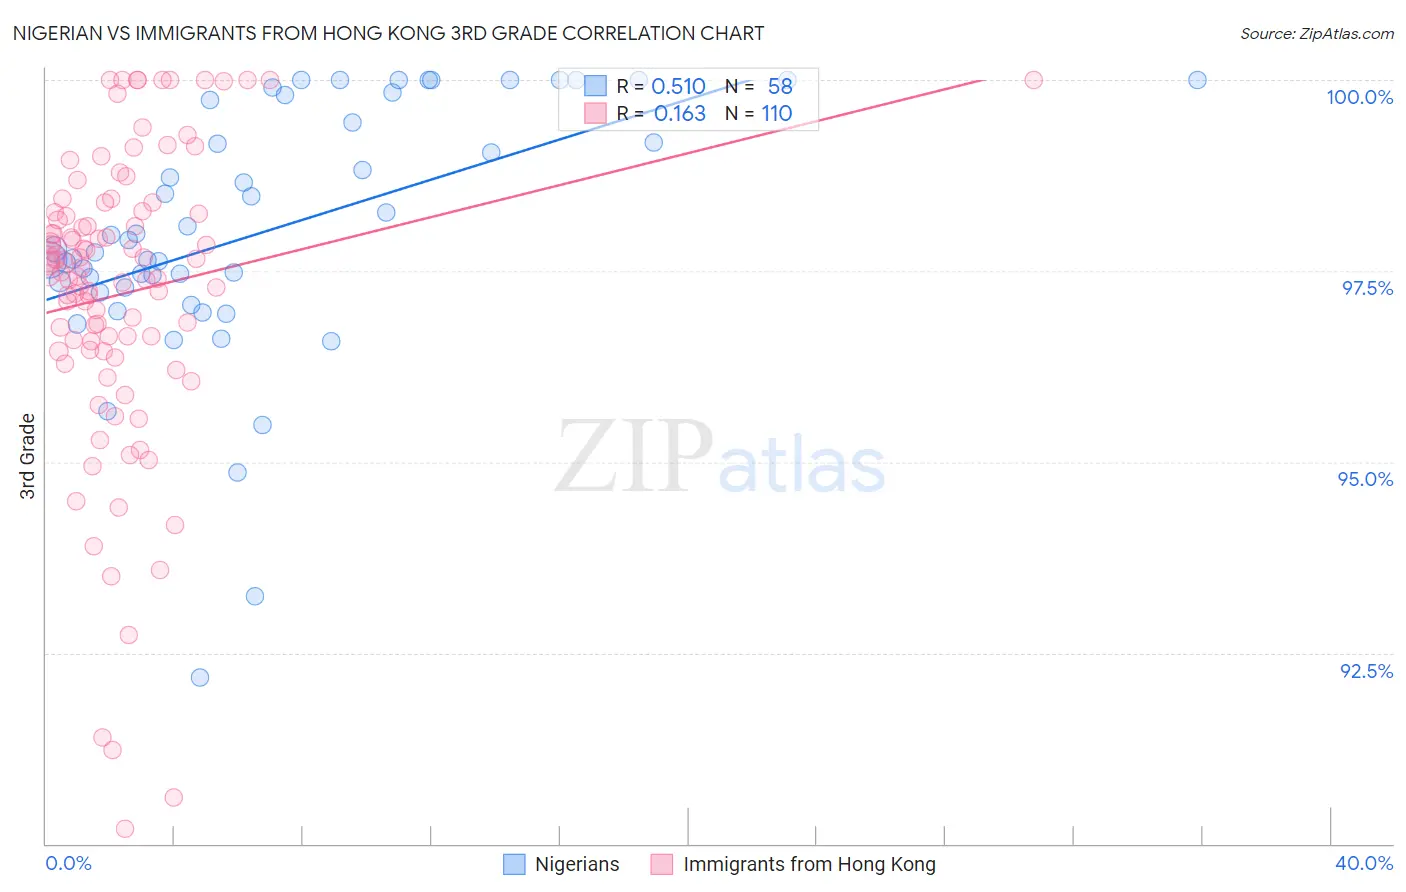
Nigerian vs Immigrants from Hong Kong 3rd Grade Correlation Chart
The statistical analysis conducted on geographies consisting of 332,724,627 people shows a substantial positive correlation between the proportion of Nigerians and percentage of population with at least 3rd grade education in the United States with a correlation coefficient (R) of 0.510 and weighted average of 97.4%. Similarly, the statistical analysis conducted on geographies consisting of 253,948,669 people shows a poor positive correlation between the proportion of Immigrants from Hong Kong and percentage of population with at least 3rd grade education in the United States with a correlation coefficient (R) of 0.163 and weighted average of 97.1%, a difference of 0.32%.
3rd Grade Correlation Summary
| Measurement | Nigerian | Immigrants from Hong Kong |
| Minimum | 92.2% | 90.2% |
| Maximum | 100.0% | 100.0% |
| Range | 7.8% | 9.8% |
| Mean | 98.0% | 97.2% |
| Median | 97.8% | 97.5% |
| Interquartile 25% (IQ1) | 97.3% | 96.5% |
| Interquartile 75% (IQ3) | 99.7% | 98.3% |
| Interquartile Range (IQR) | 2.4% | 1.8% |
| Standard Deviation (Sample) | 1.7% | 2.0% |
| Standard Deviation (Population) | 1.7% | 2.0% |
Similar Demographics by 3rd Grade
Demographics Similar to Nigerians by 3rd Grade
In terms of 3rd grade, the demographic groups most similar to Nigerians are Immigrants from Iraq (97.4%, a difference of 0.010%), Liberian (97.4%, a difference of 0.010%), Colombian (97.4%, a difference of 0.010%), Immigrants from Uruguay (97.4%, a difference of 0.010%), and U.S. Virgin Islander (97.4%, a difference of 0.010%).
| Demographics | Rating | Rank | 3rd Grade |
| Immigrants | Western Asia | 2.6 /100 | #232 | Tragic 97.5% |
| Immigrants | Malaysia | 2.4 /100 | #233 | Tragic 97.5% |
| Immigrants | Eastern Asia | 1.9 /100 | #234 | Tragic 97.4% |
| Immigrants | Iraq | 1.8 /100 | #235 | Tragic 97.4% |
| Liberians | 1.8 /100 | #236 | Tragic 97.4% |
| Colombians | 1.8 /100 | #237 | Tragic 97.4% |
| Immigrants | Uruguay | 1.7 /100 | #238 | Tragic 97.4% |
| Nigerians | 1.6 /100 | #239 | Tragic 97.4% |
| U.S. Virgin Islanders | 1.4 /100 | #240 | Tragic 97.4% |
| Immigrants | Indonesia | 1.4 /100 | #241 | Tragic 97.4% |
| Koreans | 1.3 /100 | #242 | Tragic 97.4% |
| Indians (Asian) | 1.3 /100 | #243 | Tragic 97.4% |
| Asians | 1.1 /100 | #244 | Tragic 97.4% |
| Ethiopians | 1.1 /100 | #245 | Tragic 97.4% |
| Immigrants | Senegal | 1.0 /100 | #246 | Tragic 97.4% |
Demographics Similar to Immigrants from Hong Kong by 3rd Grade
In terms of 3rd grade, the demographic groups most similar to Immigrants from Hong Kong are Immigrants from Barbados (97.1%, a difference of 0.010%), Immigrants from Trinidad and Tobago (97.1%, a difference of 0.020%), Immigrants from St. Vincent and the Grenadines (97.1%, a difference of 0.020%), Immigrants from West Indies (97.1%, a difference of 0.030%), and Immigrants from Thailand (97.1%, a difference of 0.030%).
| Demographics | Rating | Rank | 3rd Grade |
| Immigrants | Western Africa | 0.1 /100 | #278 | Tragic 97.2% |
| Immigrants | Philippines | 0.1 /100 | #279 | Tragic 97.2% |
| Immigrants | Ghana | 0.1 /100 | #280 | Tragic 97.2% |
| Barbadians | 0.1 /100 | #281 | Tragic 97.2% |
| Afghans | 0.1 /100 | #282 | Tragic 97.1% |
| Houma | 0.1 /100 | #283 | Tragic 97.1% |
| Immigrants | Trinidad and Tobago | 0.0 /100 | #284 | Tragic 97.1% |
| Immigrants | Hong Kong | 0.0 /100 | #285 | Tragic 97.1% |
| Immigrants | Barbados | 0.0 /100 | #286 | Tragic 97.1% |
| Immigrants | St. Vincent and the Grenadines | 0.0 /100 | #287 | Tragic 97.1% |
| Immigrants | West Indies | 0.0 /100 | #288 | Tragic 97.1% |
| Immigrants | Thailand | 0.0 /100 | #289 | Tragic 97.1% |
| Immigrants | Portugal | 0.0 /100 | #290 | Tragic 97.0% |
| Immigrants | Afghanistan | 0.0 /100 | #291 | Tragic 97.0% |
| British West Indians | 0.0 /100 | #292 | Tragic 97.0% |