Nigerian vs Mongolian Nursery School
COMPARE
Nigerian
Mongolian
Nursery School
Nursery School Comparison
Nigerians
Mongolians
97.7%
NURSERY SCHOOL
1.7/ 100
METRIC RATING
238th/ 347
METRIC RANK
97.9%
NURSERY SCHOOL
27.3/ 100
METRIC RATING
194th/ 347
METRIC RANK
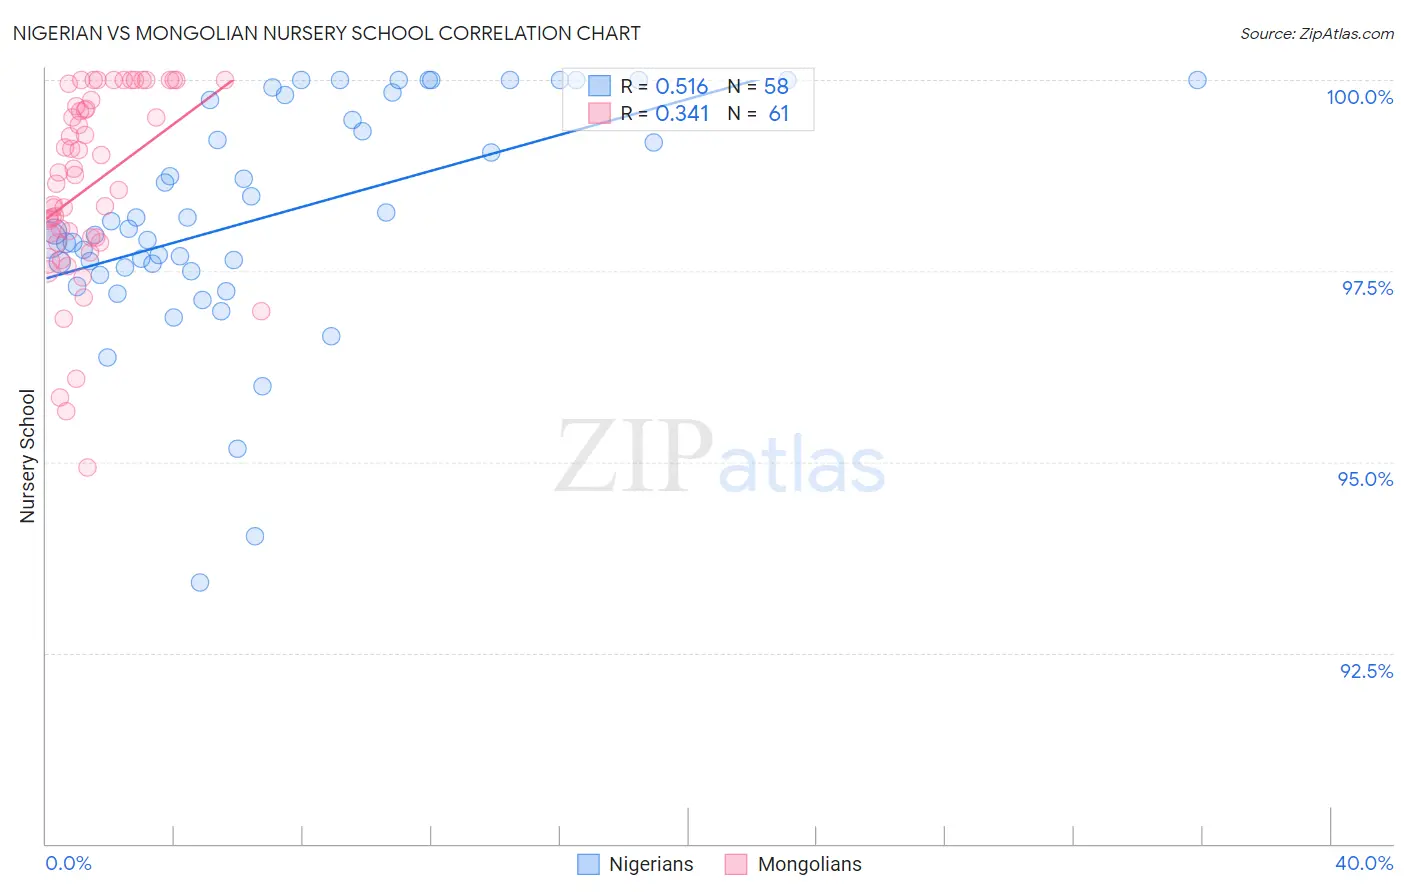
Nigerian vs Mongolian Nursery School Correlation Chart
The statistical analysis conducted on geographies consisting of 332,724,627 people shows a substantial positive correlation between the proportion of Nigerians and percentage of population with at least nursery school education in the United States with a correlation coefficient (R) of 0.516 and weighted average of 97.7%. Similarly, the statistical analysis conducted on geographies consisting of 140,362,004 people shows a mild positive correlation between the proportion of Mongolians and percentage of population with at least nursery school education in the United States with a correlation coefficient (R) of 0.341 and weighted average of 97.9%, a difference of 0.23%.
Nursery School Correlation Summary
| Measurement | Nigerian | Mongolian |
| Minimum | 93.4% | 94.9% |
| Maximum | 100.0% | 100.0% |
| Range | 6.6% | 5.1% |
| Mean | 98.2% | 98.6% |
| Median | 98.0% | 98.8% |
| Interquartile 25% (IQ1) | 97.5% | 97.9% |
| Interquartile 75% (IQ3) | 99.7% | 99.7% |
| Interquartile Range (IQR) | 2.2% | 1.8% |
| Standard Deviation (Sample) | 1.5% | 1.2% |
| Standard Deviation (Population) | 1.5% | 1.2% |
Similar Demographics by Nursery School
Demographics Similar to Nigerians by Nursery School
In terms of nursery school, the demographic groups most similar to Nigerians are Immigrants from Malaysia (97.7%, a difference of 0.010%), Immigrants from Western Asia (97.7%, a difference of 0.010%), Immigrants from Eastern Asia (97.7%, a difference of 0.010%), Korean (97.7%, a difference of 0.010%), and Immigrants from Uruguay (97.7%, a difference of 0.020%).
| Demographics | Rating | Rank | Nursery School |
| Puerto Ricans | 2.6 /100 | #231 | Tragic 97.7% |
| Immigrants | Uruguay | 2.3 /100 | #232 | Tragic 97.7% |
| U.S. Virgin Islanders | 2.1 /100 | #233 | Tragic 97.7% |
| Colombians | 2.1 /100 | #234 | Tragic 97.7% |
| Immigrants | Pakistan | 2.1 /100 | #235 | Tragic 97.7% |
| Immigrants | Malaysia | 1.9 /100 | #236 | Tragic 97.7% |
| Immigrants | Western Asia | 1.9 /100 | #237 | Tragic 97.7% |
| Nigerians | 1.7 /100 | #238 | Tragic 97.7% |
| Immigrants | Eastern Asia | 1.6 /100 | #239 | Tragic 97.7% |
| Koreans | 1.4 /100 | #240 | Tragic 97.7% |
| Immigrants | Indonesia | 1.1 /100 | #241 | Tragic 97.7% |
| Liberians | 1.1 /100 | #242 | Tragic 97.7% |
| Asians | 1.1 /100 | #243 | Tragic 97.6% |
| South Americans | 1.0 /100 | #244 | Tragic 97.6% |
| Bolivians | 1.0 /100 | #245 | Tragic 97.6% |
Demographics Similar to Mongolians by Nursery School
In terms of nursery school, the demographic groups most similar to Mongolians are Paraguayan (97.9%, a difference of 0.0%), Hawaiian (97.9%, a difference of 0.0%), Immigrants from Taiwan (97.9%, a difference of 0.010%), Black/African American (97.9%, a difference of 0.010%), and Guamanian/Chamorro (97.9%, a difference of 0.010%).
| Demographics | Rating | Rank | Nursery School |
| Immigrants | Kazakhstan | 37.1 /100 | #187 | Fair 97.9% |
| Arabs | 34.7 /100 | #188 | Fair 97.9% |
| Pakistanis | 34.6 /100 | #189 | Fair 97.9% |
| Panamanians | 34.3 /100 | #190 | Fair 97.9% |
| Immigrants | Taiwan | 30.6 /100 | #191 | Fair 97.9% |
| Blacks/African Americans | 29.4 /100 | #192 | Fair 97.9% |
| Paraguayans | 27.4 /100 | #193 | Fair 97.9% |
| Mongolians | 27.3 /100 | #194 | Fair 97.9% |
| Hawaiians | 27.2 /100 | #195 | Fair 97.9% |
| Guamanians/Chamorros | 25.7 /100 | #196 | Fair 97.9% |
| Yuman | 25.7 /100 | #197 | Fair 97.9% |
| Immigrants | Kenya | 24.1 /100 | #198 | Fair 97.9% |
| Immigrants | Egypt | 22.5 /100 | #199 | Fair 97.9% |
| Tohono O'odham | 22.2 /100 | #200 | Fair 97.9% |
| Immigrants | Lebanon | 21.2 /100 | #201 | Fair 97.9% |