Iraqi vs Immigrants from Asia High School Diploma
COMPARE
Iraqi
Immigrants from Asia
High School Diploma
High School Diploma Comparison
Iraqis
Immigrants from Asia
89.5%
HIGH SCHOOL DIPLOMA
73.9/ 100
METRIC RATING
147th/ 347
METRIC RANK
89.3%
HIGH SCHOOL DIPLOMA
59.8/ 100
METRIC RATING
165th/ 347
METRIC RANK
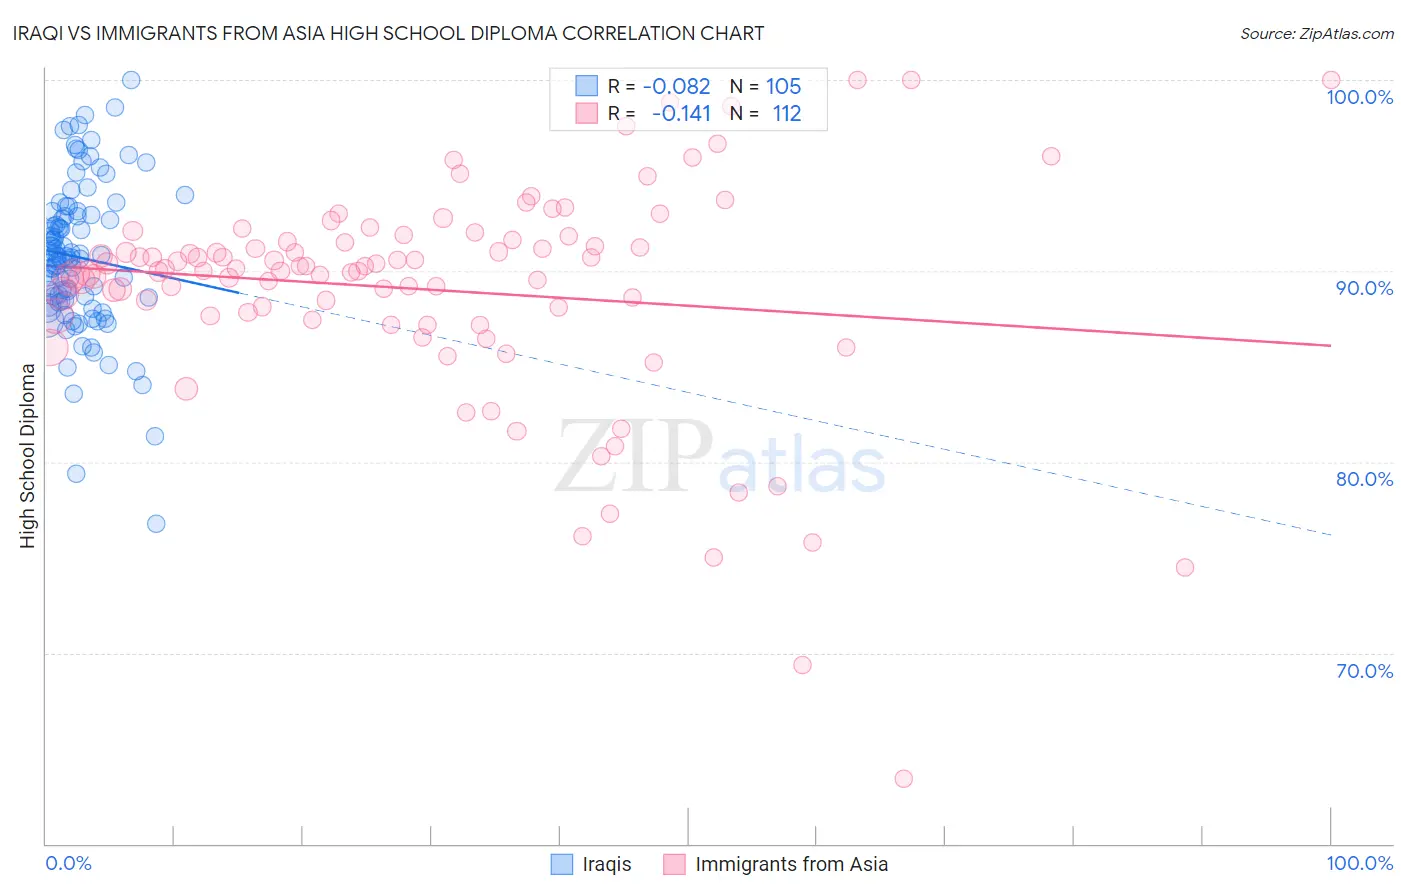
Iraqi vs Immigrants from Asia High School Diploma Correlation Chart
The statistical analysis conducted on geographies consisting of 170,614,457 people shows a slight negative correlation between the proportion of Iraqis and percentage of population with at least high school diploma education in the United States with a correlation coefficient (R) of -0.082 and weighted average of 89.5%. Similarly, the statistical analysis conducted on geographies consisting of 549,170,250 people shows a poor negative correlation between the proportion of Immigrants from Asia and percentage of population with at least high school diploma education in the United States with a correlation coefficient (R) of -0.141 and weighted average of 89.3%, a difference of 0.24%.
High School Diploma Correlation Summary
| Measurement | Iraqi | Immigrants from Asia |
| Minimum | 76.8% | 63.4% |
| Maximum | 100.0% | 100.0% |
| Range | 23.2% | 36.6% |
| Mean | 90.7% | 89.0% |
| Median | 90.7% | 90.1% |
| Interquartile 25% (IQ1) | 88.4% | 87.7% |
| Interquartile 75% (IQ3) | 93.0% | 91.6% |
| Interquartile Range (IQR) | 4.6% | 3.9% |
| Standard Deviation (Sample) | 4.0% | 5.9% |
| Standard Deviation (Population) | 4.0% | 5.8% |
Demographics Similar to Iraqis and Immigrants from Asia by High School Diploma
In terms of high school diploma, the demographic groups most similar to Iraqis are Immigrants from Lebanon (89.5%, a difference of 0.010%), Immigrants from Poland (89.5%, a difference of 0.020%), Argentinean (89.5%, a difference of 0.030%), Immigrants from Spain (89.5%, a difference of 0.050%), and Paraguayan (89.5%, a difference of 0.050%). Similarly, the demographic groups most similar to Immigrants from Asia are Immigrants from Albania (89.3%, a difference of 0.010%), Brazilian (89.3%, a difference of 0.020%), Bermudan (89.3%, a difference of 0.020%), Cree (89.3%, a difference of 0.020%), and Immigrants from Nepal (89.3%, a difference of 0.020%).
| Demographics | Rating | Rank | High School Diploma |
| Immigrants | Spain | 76.2 /100 | #146 | Good 89.5% |
| Iraqis | 73.9 /100 | #147 | Good 89.5% |
| Immigrants | Lebanon | 73.4 /100 | #148 | Good 89.5% |
| Immigrants | Poland | 72.9 /100 | #149 | Good 89.5% |
| Argentineans | 72.3 /100 | #150 | Good 89.5% |
| Paraguayans | 71.4 /100 | #151 | Good 89.5% |
| Asians | 70.7 /100 | #152 | Good 89.4% |
| Immigrants | Iraq | 68.7 /100 | #153 | Good 89.4% |
| Alsatians | 66.8 /100 | #154 | Good 89.4% |
| Immigrants | Northern Africa | 66.4 /100 | #155 | Good 89.4% |
| Immigrants | Argentina | 65.5 /100 | #156 | Good 89.4% |
| Immigrants | Malaysia | 63.5 /100 | #157 | Good 89.3% |
| Immigrants | Pakistan | 62.5 /100 | #158 | Good 89.3% |
| Immigrants | China | 62.0 /100 | #159 | Good 89.3% |
| Laotians | 61.8 /100 | #160 | Good 89.3% |
| Brazilians | 61.2 /100 | #161 | Good 89.3% |
| Bermudans | 61.1 /100 | #162 | Good 89.3% |
| Cree | 61.1 /100 | #163 | Good 89.3% |
| Immigrants | Nepal | 61.1 /100 | #164 | Good 89.3% |
| Immigrants | Asia | 59.8 /100 | #165 | Average 89.3% |
| Immigrants | Albania | 59.4 /100 | #166 | Average 89.3% |