Nigerian vs Houma 2nd Grade
COMPARE
Nigerian
Houma
2nd Grade
2nd Grade Comparison
Nigerians
Houma
97.6%
2ND GRADE
1.7/ 100
METRIC RATING
236th/ 347
METRIC RANK
97.2%
2ND GRADE
0.0/ 100
METRIC RATING
289th/ 347
METRIC RANK
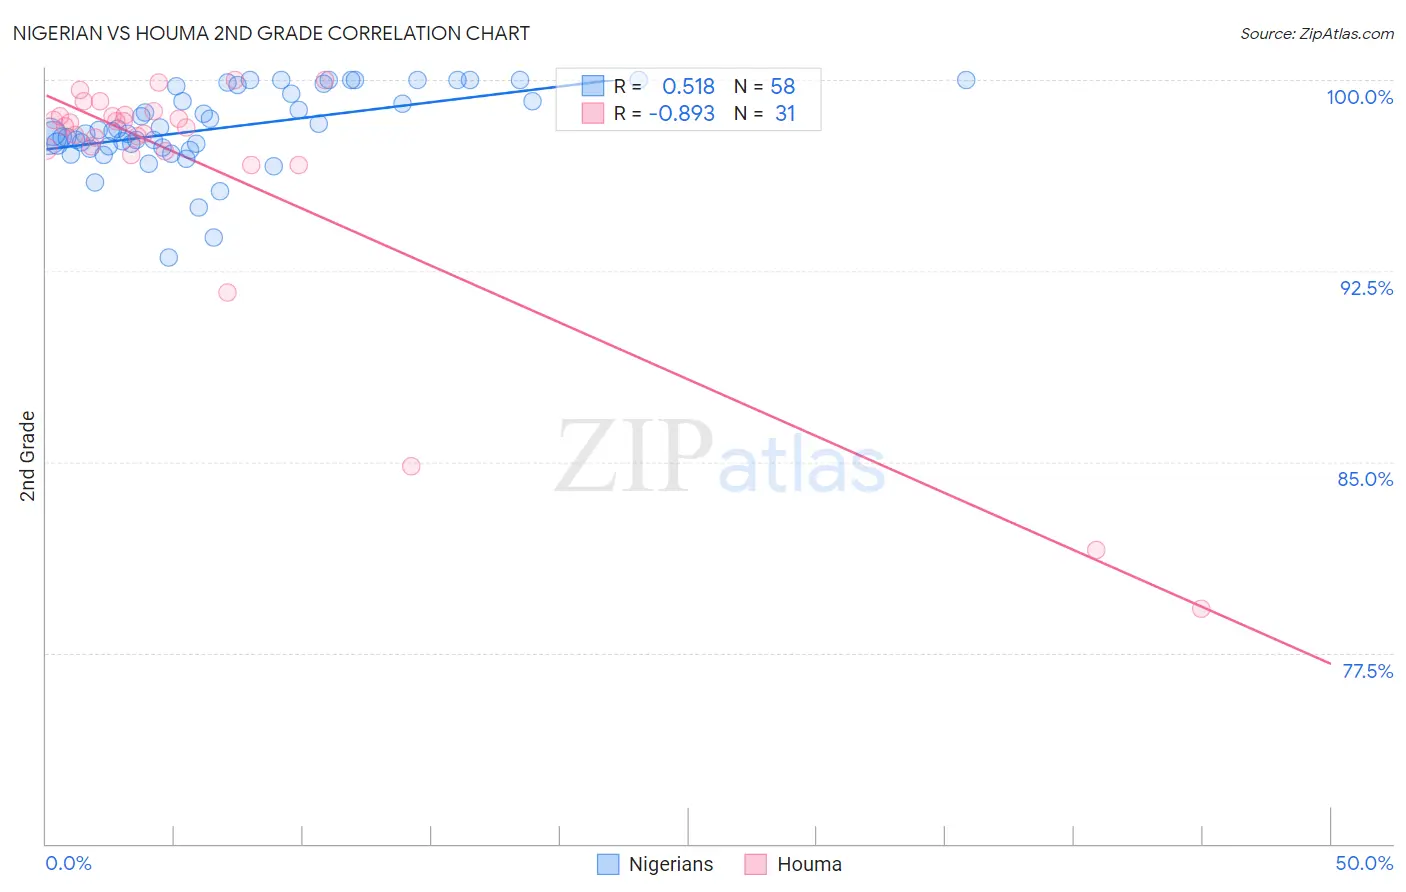
Nigerian vs Houma 2nd Grade Correlation Chart
The statistical analysis conducted on geographies consisting of 332,724,627 people shows a substantial positive correlation between the proportion of Nigerians and percentage of population with at least 2nd grade education in the United States with a correlation coefficient (R) of 0.518 and weighted average of 97.6%. Similarly, the statistical analysis conducted on geographies consisting of 36,795,916 people shows a very strong negative correlation between the proportion of Houma and percentage of population with at least 2nd grade education in the United States with a correlation coefficient (R) of -0.893 and weighted average of 97.2%, a difference of 0.37%.
2nd Grade Correlation Summary
| Measurement | Nigerian | Houma |
| Minimum | 93.0% | 79.2% |
| Maximum | 100.0% | 100.0% |
| Range | 7.0% | 20.8% |
| Mean | 98.1% | 96.5% |
| Median | 97.9% | 98.2% |
| Interquartile 25% (IQ1) | 97.4% | 97.2% |
| Interquartile 75% (IQ3) | 99.7% | 98.6% |
| Interquartile Range (IQR) | 2.3% | 1.4% |
| Standard Deviation (Sample) | 1.5% | 5.1% |
| Standard Deviation (Population) | 1.5% | 5.1% |
Similar Demographics by 2nd Grade
Demographics Similar to Nigerians by 2nd Grade
In terms of 2nd grade, the demographic groups most similar to Nigerians are U.S. Virgin Islander (97.6%, a difference of 0.0%), Immigrants from Eastern Asia (97.6%, a difference of 0.0%), Liberian (97.6%, a difference of 0.0%), Immigrants from Malaysia (97.6%, a difference of 0.010%), and Colombian (97.6%, a difference of 0.010%).
| Demographics | Rating | Rank | 2nd Grade |
| Immigrants | Costa Rica | 3.1 /100 | #229 | Tragic 97.6% |
| Senegalese | 3.1 /100 | #230 | Tragic 97.6% |
| Immigrants | Pakistan | 2.3 /100 | #231 | Tragic 97.6% |
| Immigrants | Western Asia | 2.1 /100 | #232 | Tragic 97.6% |
| Immigrants | Uruguay | 2.1 /100 | #233 | Tragic 97.6% |
| Immigrants | Malaysia | 2.0 /100 | #234 | Tragic 97.6% |
| Colombians | 1.9 /100 | #235 | Tragic 97.6% |
| Nigerians | 1.7 /100 | #236 | Tragic 97.6% |
| U.S. Virgin Islanders | 1.6 /100 | #237 | Tragic 97.6% |
| Immigrants | Eastern Asia | 1.6 /100 | #238 | Tragic 97.6% |
| Liberians | 1.6 /100 | #239 | Tragic 97.6% |
| Koreans | 1.5 /100 | #240 | Tragic 97.5% |
| Ethiopians | 1.2 /100 | #241 | Tragic 97.5% |
| Immigrants | Indonesia | 1.2 /100 | #242 | Tragic 97.5% |
| Asians | 1.1 /100 | #243 | Tragic 97.5% |
Demographics Similar to Houma by 2nd Grade
In terms of 2nd grade, the demographic groups most similar to Houma are Immigrants from St. Vincent and the Grenadines (97.2%, a difference of 0.0%), Immigrants from Afghanistan (97.2%, a difference of 0.010%), Immigrants from Barbados (97.2%, a difference of 0.020%), Immigrants from Portugal (97.2%, a difference of 0.020%), and Immigrants from Thailand (97.2%, a difference of 0.020%).
| Demographics | Rating | Rank | 2nd Grade |
| Barbadians | 0.1 /100 | #282 | Tragic 97.3% |
| Immigrants | Trinidad and Tobago | 0.0 /100 | #283 | Tragic 97.2% |
| Immigrants | West Indies | 0.0 /100 | #284 | Tragic 97.2% |
| Immigrants | Hong Kong | 0.0 /100 | #285 | Tragic 97.2% |
| Immigrants | Barbados | 0.0 /100 | #286 | Tragic 97.2% |
| Immigrants | Portugal | 0.0 /100 | #287 | Tragic 97.2% |
| Immigrants | Thailand | 0.0 /100 | #288 | Tragic 97.2% |
| Houma | 0.0 /100 | #289 | Tragic 97.2% |
| Immigrants | St. Vincent and the Grenadines | 0.0 /100 | #290 | Tragic 97.2% |
| Immigrants | Afghanistan | 0.0 /100 | #291 | Tragic 97.2% |
| Immigrants | Eritrea | 0.0 /100 | #292 | Tragic 97.2% |
| British West Indians | 0.0 /100 | #293 | Tragic 97.2% |
| Malaysians | 0.0 /100 | #294 | Tragic 97.1% |
| Immigrants | Grenada | 0.0 /100 | #295 | Tragic 97.1% |
| Immigrants | Immigrants | 0.0 /100 | #296 | Tragic 97.1% |