Immigrants from Moldova vs Houma 2nd Grade
COMPARE
Immigrants from Moldova
Houma
2nd Grade
2nd Grade Comparison
Immigrants from Moldova
Houma
97.9%
2ND GRADE
72.9/ 100
METRIC RATING
150th/ 347
METRIC RANK
97.2%
2ND GRADE
0.0/ 100
METRIC RATING
289th/ 347
METRIC RANK
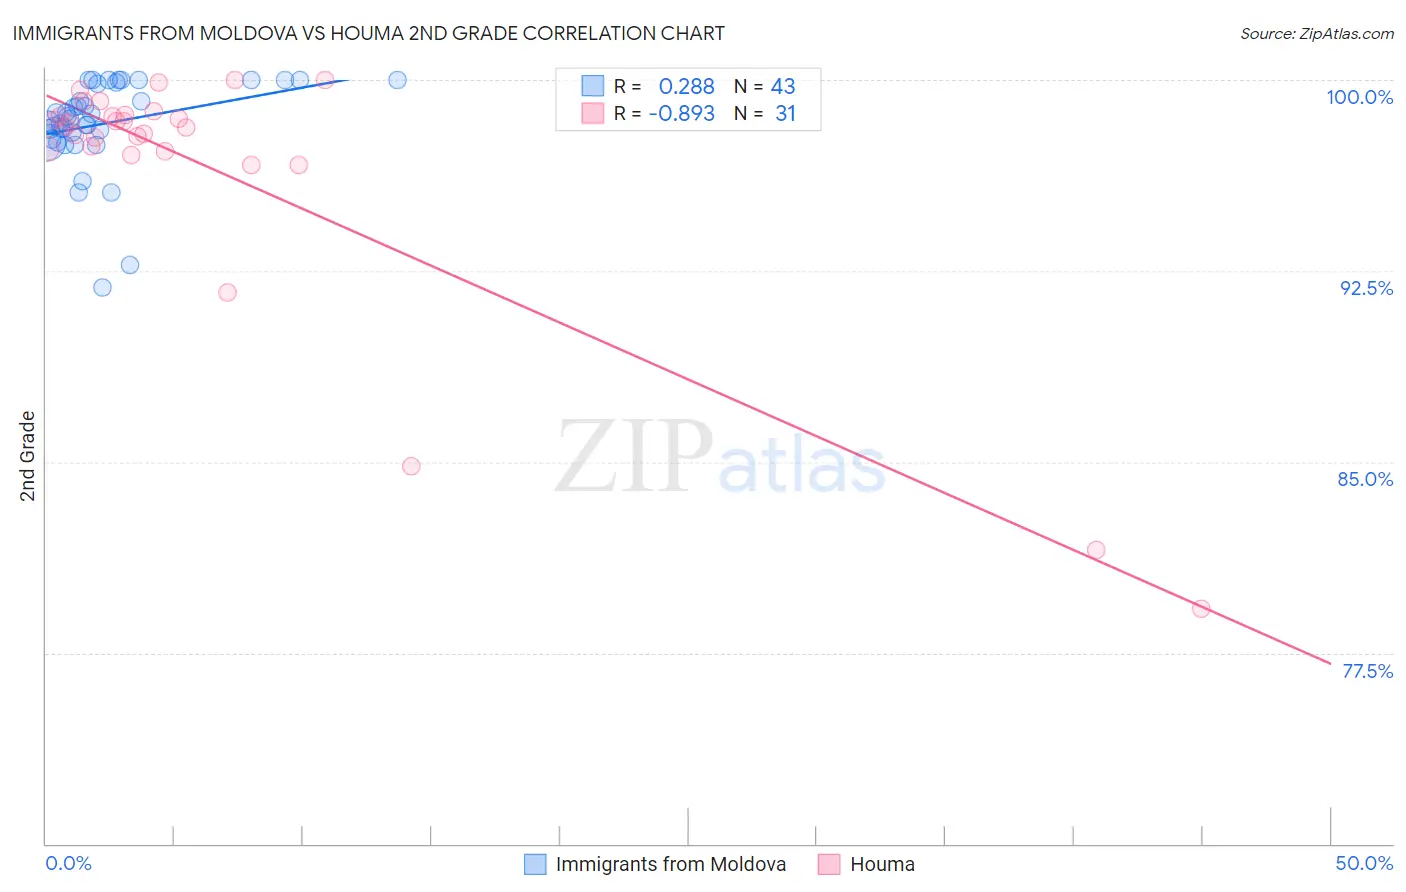
Immigrants from Moldova vs Houma 2nd Grade Correlation Chart
The statistical analysis conducted on geographies consisting of 124,398,501 people shows a weak positive correlation between the proportion of Immigrants from Moldova and percentage of population with at least 2nd grade education in the United States with a correlation coefficient (R) of 0.288 and weighted average of 97.9%. Similarly, the statistical analysis conducted on geographies consisting of 36,795,916 people shows a very strong negative correlation between the proportion of Houma and percentage of population with at least 2nd grade education in the United States with a correlation coefficient (R) of -0.893 and weighted average of 97.2%, a difference of 0.77%.
2nd Grade Correlation Summary
| Measurement | Immigrants from Moldova | Houma |
| Minimum | 91.8% | 79.2% |
| Maximum | 100.0% | 100.0% |
| Range | 8.2% | 20.8% |
| Mean | 98.3% | 96.5% |
| Median | 98.5% | 98.2% |
| Interquartile 25% (IQ1) | 97.7% | 97.2% |
| Interquartile 75% (IQ3) | 99.9% | 98.6% |
| Interquartile Range (IQR) | 2.2% | 1.4% |
| Standard Deviation (Sample) | 1.8% | 5.1% |
| Standard Deviation (Population) | 1.8% | 5.1% |
Similar Demographics by 2nd Grade
Demographics Similar to Immigrants from Moldova by 2nd Grade
In terms of 2nd grade, the demographic groups most similar to Immigrants from Moldova are Apache (97.9%, a difference of 0.0%), Jordanian (98.0%, a difference of 0.010%), Soviet Union (97.9%, a difference of 0.010%), Immigrants from Israel (98.0%, a difference of 0.020%), and Immigrants from Greece (98.0%, a difference of 0.020%).
| Demographics | Rating | Rank | 2nd Grade |
| Alsatians | 80.5 /100 | #143 | Excellent 98.0% |
| Hmong | 80.0 /100 | #144 | Good 98.0% |
| Filipinos | 79.2 /100 | #145 | Good 98.0% |
| Immigrants | Israel | 78.0 /100 | #146 | Good 98.0% |
| Immigrants | Greece | 76.8 /100 | #147 | Good 98.0% |
| Jordanians | 74.5 /100 | #148 | Good 98.0% |
| Apache | 74.0 /100 | #149 | Good 97.9% |
| Immigrants | Moldova | 72.9 /100 | #150 | Good 97.9% |
| Soviet Union | 70.7 /100 | #151 | Good 97.9% |
| Immigrants | North Macedonia | 68.5 /100 | #152 | Good 97.9% |
| Immigrants | South Central Asia | 68.3 /100 | #153 | Good 97.9% |
| Marshallese | 67.7 /100 | #154 | Good 97.9% |
| French American Indians | 64.3 /100 | #155 | Good 97.9% |
| Dutch West Indians | 63.8 /100 | #156 | Good 97.9% |
| Venezuelans | 63.3 /100 | #157 | Good 97.9% |
Demographics Similar to Houma by 2nd Grade
In terms of 2nd grade, the demographic groups most similar to Houma are Immigrants from St. Vincent and the Grenadines (97.2%, a difference of 0.0%), Immigrants from Afghanistan (97.2%, a difference of 0.010%), Immigrants from Barbados (97.2%, a difference of 0.020%), Immigrants from Portugal (97.2%, a difference of 0.020%), and Immigrants from Thailand (97.2%, a difference of 0.020%).
| Demographics | Rating | Rank | 2nd Grade |
| Barbadians | 0.1 /100 | #282 | Tragic 97.3% |
| Immigrants | Trinidad and Tobago | 0.0 /100 | #283 | Tragic 97.2% |
| Immigrants | West Indies | 0.0 /100 | #284 | Tragic 97.2% |
| Immigrants | Hong Kong | 0.0 /100 | #285 | Tragic 97.2% |
| Immigrants | Barbados | 0.0 /100 | #286 | Tragic 97.2% |
| Immigrants | Portugal | 0.0 /100 | #287 | Tragic 97.2% |
| Immigrants | Thailand | 0.0 /100 | #288 | Tragic 97.2% |
| Houma | 0.0 /100 | #289 | Tragic 97.2% |
| Immigrants | St. Vincent and the Grenadines | 0.0 /100 | #290 | Tragic 97.2% |
| Immigrants | Afghanistan | 0.0 /100 | #291 | Tragic 97.2% |
| Immigrants | Eritrea | 0.0 /100 | #292 | Tragic 97.2% |
| British West Indians | 0.0 /100 | #293 | Tragic 97.2% |
| Malaysians | 0.0 /100 | #294 | Tragic 97.1% |
| Immigrants | Grenada | 0.0 /100 | #295 | Tragic 97.1% |
| Immigrants | Immigrants | 0.0 /100 | #296 | Tragic 97.1% |