Bangladeshi vs Houma 2nd Grade

COMPARE

Bangladeshi
Race
Ancestry
AfghanAfricanAlaska NativeAlaskan AthabascanAlbanianAleutAlsatianAmericanApacheArabArapahoArgentineanArmenianAssyrian/Chaldean/SyriacAustralianAustrianBahamianBangladeshiBarbadianBasqueBelgianBelizeanBermudanBhutaneseBlackfeetBolivianBrazilianBritishBritish West IndianBulgarianBurmeseCajunCambodianCanadianCape VerdeanCarpatho RusynCelticCentral AmericanCentral American IndianCherokeeCheyenneChickasawChileanChineseChippewaChoctawColombianColvilleComancheCosta RicanCreeCreekCroatianCrowCubanCypriotCzechCzechoslovakianDanishDelawareDominicanDutchDutch West IndianEastern EuropeanEcuadorianEgyptianEnglishEstonianEthiopianEuropeanFijianFilipinoFinnishFrenchFrench American IndianFrench CanadianGermanGerman RussianGhanaianGreekGuamanian/ChamorroGuatemalanGuyaneseHaitianHmongHonduranHopiHungarianIcelanderIndian (Asian)IndonesianInupiatIranianIraqiIrishIroquoisIsraeliItalianJamaicanJapaneseJordanianKenyanKiowaKoreanLaotianLatvianLebaneseLiberianLithuanianLumbeeLuxembourgerMacedonianMalaysianMalteseMarshalleseMenomineeMexicanMexican American IndianMongolianMoroccanNative HawaiianNavajoNepaleseNew ZealanderNicaraguanNigerianNorthern EuropeanNorwegianOkinawanOsageOttawaPaiutePakistaniPalestinianPanamanianParaguayanPennsylvania GermanPeruvianPimaPolishPortuguesePotawatomiPuebloPuerto RicanPuget Sound SalishRomanianRussianSalvadoranSamoanScandinavianScotch-IrishScottishSeminoleSenegaleseSerbianShoshoneSierra LeoneanSiouxSlavicSlovakSloveneSomaliSouth AfricanSouth AmericanSouth American IndianSoviet UnionSpaniardSpanishSpanish AmericanSpanish American IndianSri LankanSubsaharan AfricanSudaneseSwedishSwissSyrianTaiwaneseThaiTlingit-HaidaTohono O'OdhamTonganTrinidadian and TobagonianTsimshianTurkishU.S. Virgin IslanderUgandanUkrainianUruguayanUteVenezuelanVietnameseWelshWest IndianYakamaYaquiYugoslavianYumanYup'ikZimbabwean
Immigration
NonimmigrantsImmigrantsAfghanistanAfricaAlbaniaArgentinaArmeniaAsiaAustraliaAustriaBahamasBangladeshBarbadosBelarusBelgiumBelizeBoliviaBosnia and HerzegovinaBrazilBulgariaBurma/MyanmarCabo VerdeCambodiaCameroonCanadaCaribbeanCentral AmericaChileChinaColombiaCongoCosta RicaCroatiaCubaCzechoslovakiaDenmarkDominicaDominican RepublicEastern AfricaEastern AsiaEastern EuropeEcuadorEgyptEl SalvadorEnglandEritreaEthiopiaEuropeFijiFranceGermanyGhanaGreeceGrenadaGuatemalaGuyanaHaitiHondurasHong KongHungaryIndiaIndonesiaIranIraqIrelandIsraelItalyJamaicaJapanJordanKazakhstanKenyaKoreaKuwaitLaosLatin AmericaLatviaLebanonLiberiaLithuaniaMalaysiaMexicoMicronesiaMiddle AfricaMoldovaMoroccoNepalNetherlandsNicaraguaNigeriaNorth AmericaNorth MacedoniaNorthern AfricaNorthern EuropeNorwayOceaniaPakistanPanamaPeruPhilippinesPolandPortugalRomaniaRussiaSaudi ArabiaScotlandSenegalSerbiaSierra LeoneSingaporeSomaliaSouth AfricaSouth AmericaSouth Central AsiaSouth Eastern AsiaSouthern EuropeSpainSri LankaSt. Vincent and the GrenadinesSudanSwedenSwitzerlandSyriaTaiwanThailandTrinidad and TobagoTurkeyUgandaUkraineUruguayUzbekistanVenezuelaVietnamWest IndiesWestern AfricaWestern AsiaWestern EuropeYemenZaireZimbabweAzores
Houma
Race
Ancestry
AfghanAfricanAlaska NativeAlaskan AthabascanAlbanianAleutAlsatianAmericanApacheArabArapahoArgentineanArmenianAssyrian/Chaldean/SyriacAustralianAustrianBahamianBarbadianBasqueBelgianBelizeanBermudanBhutaneseBlackfeetBolivianBrazilianBritishBritish West IndianBulgarianBurmeseCajunCambodianCanadianCape VerdeanCarpatho RusynCelticCentral AmericanCentral American IndianCherokeeCheyenneChickasawChileanChineseChippewaChoctawColombianColvilleComancheCosta RicanCreeCreekCroatianCrowCubanCypriotCzechCzechoslovakianDanishDelawareDominicanDutchDutch West IndianEastern EuropeanEcuadorianEgyptianEnglishEstonianEthiopianEuropeanFijianFilipinoFinnishFrenchFrench American IndianFrench CanadianGermanGerman RussianGhanaianGreekGuamanian/ChamorroGuatemalanGuyaneseHaitianHmongHonduranHopiHoumaHungarianIcelanderIndian (Asian)IndonesianInupiatIranianIraqiIrishIroquoisIsraeliItalianJamaicanJapaneseJordanianKenyanKiowaKoreanLaotianLatvianLebaneseLiberianLithuanianLumbeeLuxembourgerMacedonianMalaysianMalteseMarshalleseMenomineeMexicanMexican American IndianMongolianMoroccanNative HawaiianNavajoNepaleseNew ZealanderNicaraguanNigerianNorthern EuropeanNorwegianOkinawanOsageOttawaPaiutePakistaniPalestinianPanamanianParaguayanPennsylvania GermanPeruvianPimaPolishPortuguesePotawatomiPuebloPuerto RicanPuget Sound SalishRomanianRussianSalvadoranSamoanScandinavianScotch-IrishScottishSeminoleSenegaleseSerbianShoshoneSierra LeoneanSiouxSlavicSlovakSloveneSomaliSouth AfricanSouth AmericanSouth American IndianSoviet UnionSpaniardSpanishSpanish AmericanSpanish American IndianSri LankanSubsaharan AfricanSudaneseSwedishSwissSyrianTaiwaneseThaiTlingit-HaidaTohono O'OdhamTonganTrinidadian and TobagonianTsimshianTurkishU.S. Virgin IslanderUgandanUkrainianUruguayanUteVenezuelanVietnameseWelshWest IndianYakamaYaquiYugoslavianYumanYup'ikZimbabwean
Immigration
NonimmigrantsImmigrantsAfghanistanAfricaAlbaniaArgentinaArmeniaAsiaAustraliaAustriaBahamasBangladeshBarbadosBelarusBelgiumBelizeBoliviaBosnia and HerzegovinaBrazilBulgariaBurma/MyanmarCabo VerdeCambodiaCameroonCanadaCaribbeanCentral AmericaChileChinaColombiaCongoCosta RicaCroatiaCubaCzechoslovakiaDenmarkDominicaDominican RepublicEastern AfricaEastern AsiaEastern EuropeEcuadorEgyptEl SalvadorEnglandEritreaEthiopiaEuropeFijiFranceGermanyGhanaGreeceGrenadaGuatemalaGuyanaHaitiHondurasHong KongHungaryIndiaIndonesiaIranIraqIrelandIsraelItalyJamaicaJapanJordanKazakhstanKenyaKoreaKuwaitLaosLatin AmericaLatviaLebanonLiberiaLithuaniaMalaysiaMexicoMicronesiaMiddle AfricaMoldovaMoroccoNepalNetherlandsNicaraguaNigeriaNorth AmericaNorth MacedoniaNorthern AfricaNorthern EuropeNorwayOceaniaPakistanPanamaPeruPhilippinesPolandPortugalRomaniaRussiaSaudi ArabiaScotlandSenegalSerbiaSierra LeoneSingaporeSomaliaSouth AfricaSouth AmericaSouth Central AsiaSouth Eastern AsiaSouthern EuropeSpainSri LankaSt. Vincent and the GrenadinesSudanSwedenSwitzerlandSyriaTaiwanThailandTrinidad and TobagoTurkeyUgandaUkraineUruguayUzbekistanVenezuelaVietnamWest IndiesWestern AfricaWestern AsiaWestern EuropeYemenZaireZimbabweAzores
2nd Grade
Income
Poverty
Unemployment
Labor Participation
Family Structure
Vehicle Availability
Education Level
Disability

2nd Grade Comparison

Bangladeshis

Houma

Tragic
Tragic
96.5%
2ND GRADE
0.0/ 100
METRIC RATING
332nd/ 347
METRIC RANK
97.2%
2ND GRADE
0.0/ 100
METRIC RATING
289th/ 347
METRIC RANK

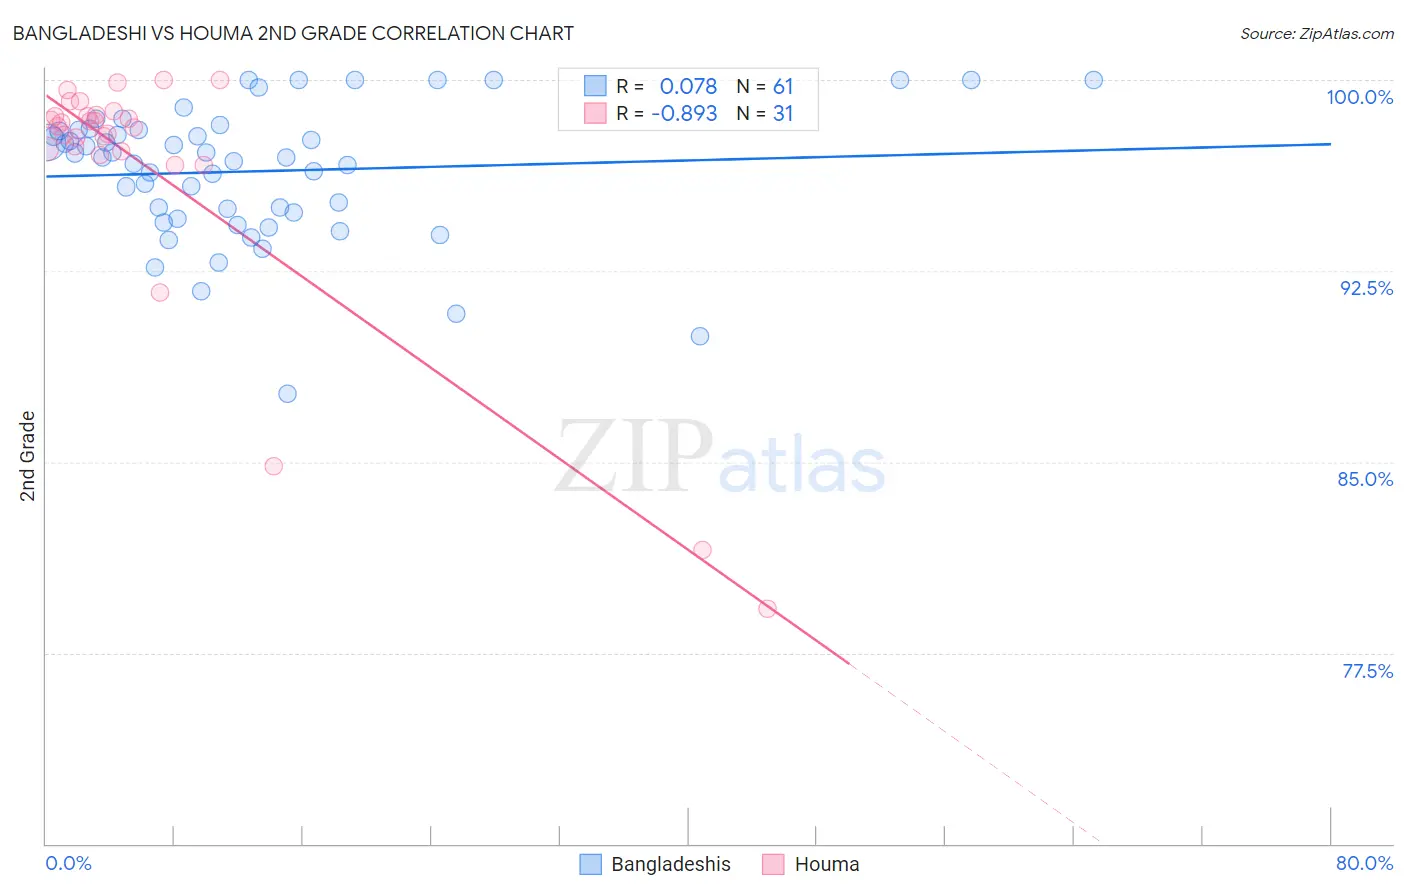
Bangladeshi vs Houma 2nd Grade Correlation Chart

The statistical analysis conducted on geographies consisting of 141,430,495 people shows a slight positive correlation between the proportion of Bangladeshis and percentage of population with at least 2nd grade education in the United States with a correlation coefficient (R) of 0.078 and weighted average of 96.5%. Similarly, the statistical analysis conducted on geographies consisting of 36,795,916 people shows a very strong negative correlation between the proportion of Houma and percentage of population with at least 2nd grade education in the United States with a correlation coefficient (R) of -0.893 and weighted average of 97.2%, a difference of 0.75%.
Bangladeshi vs Houma 2nd Grade

2nd Grade Correlation Summary

MeasurementBangladeshiHouma
Minimum87.7%79.2%
Maximum100.0%100.0%
Range12.3%20.8%
Mean96.4%96.5%
Median97.0%98.2%
Interquartile 25% (IQ1)94.7%97.2%
Interquartile 75% (IQ3)98.0%98.6%
Interquartile Range (IQR)3.4%1.4%
Standard Deviation (Sample)2.6%5.1%
Standard Deviation (Population)2.6%5.1%

Similar Demographics by 2nd Grade

Demographics Similar to Bangladeshis by 2nd Grade

In terms of 2nd grade, the demographic groups most similar to Bangladeshis are Immigrants from Armenia (96.5%, a difference of 0.010%), Immigrants from Latin America (96.5%, a difference of 0.050%), Immigrants from Vietnam (96.5%, a difference of 0.060%), Mexican (96.5%, a difference of 0.060%), and Japanese (96.5%, a difference of 0.060%).
DemographicsRating | Rank2nd Grade
Dominicans
0.0
/100
|
#325
Tragic
96.6%
Immigrants | Honduras
0.0
/100
|
#326
Tragic
96.6%
Immigrants | Vietnam
0.0
/100
|
#327
Tragic
96.5%
Mexicans
0.0
/100
|
#328
Tragic
96.5%
Japanese
0.0
/100
|
#329
Tragic
96.5%
Immigrants | Latin America
0.0
/100
|
#330
Tragic
96.5%
Immigrants | Armenia
0.0
/100
|
#331
Tragic
96.5%
Bangladeshis
0.0
/100
|
#332
Tragic
96.5%
Immigrants | Dominican Republic
0.0
/100
|
#333
Tragic
96.4%
Central Americans
0.0
/100
|
#334
Tragic
96.4%
Yakama
0.0
/100
|
#335
Tragic
96.4%
Immigrants | Fiji
0.0
/100
|
#336
Tragic
96.4%
Immigrants | Cambodia
0.0
/100
|
#337
Tragic
96.4%
Immigrants | Cabo Verde
0.0
/100
|
#338
Tragic
96.3%
Guatemalans
0.0
/100
|
#339
Tragic
96.3%

Demographics Similar to Houma by 2nd Grade

In terms of 2nd grade, the demographic groups most similar to Houma are Immigrants from St. Vincent and the Grenadines (97.2%, a difference of 0.0%), Immigrants from Afghanistan (97.2%, a difference of 0.010%), Immigrants from Barbados (97.2%, a difference of 0.020%), Immigrants from Portugal (97.2%, a difference of 0.020%), and Immigrants from Thailand (97.2%, a difference of 0.020%).
DemographicsRating | Rank2nd Grade
Barbadians
0.1
/100
|
#282
Tragic
97.3%
Immigrants | Trinidad and Tobago
0.0
/100
|
#283
Tragic
97.2%
Immigrants | West Indies
0.0
/100
|
#284
Tragic
97.2%
Immigrants | Hong Kong
0.0
/100
|
#285
Tragic
97.2%
Immigrants | Barbados
0.0
/100
|
#286
Tragic
97.2%
Immigrants | Portugal
0.0
/100
|
#287
Tragic
97.2%
Immigrants | Thailand
0.0
/100
|
#288
Tragic
97.2%
Houma
0.0
/100
|
#289
Tragic
97.2%
Immigrants | St. Vincent and the Grenadines
0.0
/100
|
#290
Tragic
97.2%
Immigrants | Afghanistan
0.0
/100
|
#291
Tragic
97.2%
Immigrants | Eritrea
0.0
/100
|
#292
Tragic
97.2%
British West Indians
0.0
/100
|
#293
Tragic
97.2%
Malaysians
0.0
/100
|
#294
Tragic
97.1%
Immigrants | Grenada
0.0
/100
|
#295
Tragic
97.1%
Immigrants | Immigrants
0.0
/100
|
#296
Tragic
97.1%