Nigerian vs Immigrants from Taiwan 2nd Grade
COMPARE
Nigerian
Immigrants from Taiwan
2nd Grade
2nd Grade Comparison
Nigerians
Immigrants from Taiwan
97.6%
2ND GRADE
1.7/ 100
METRIC RATING
236th/ 347
METRIC RANK
97.8%
2ND GRADE
31.8/ 100
METRIC RATING
190th/ 347
METRIC RANK
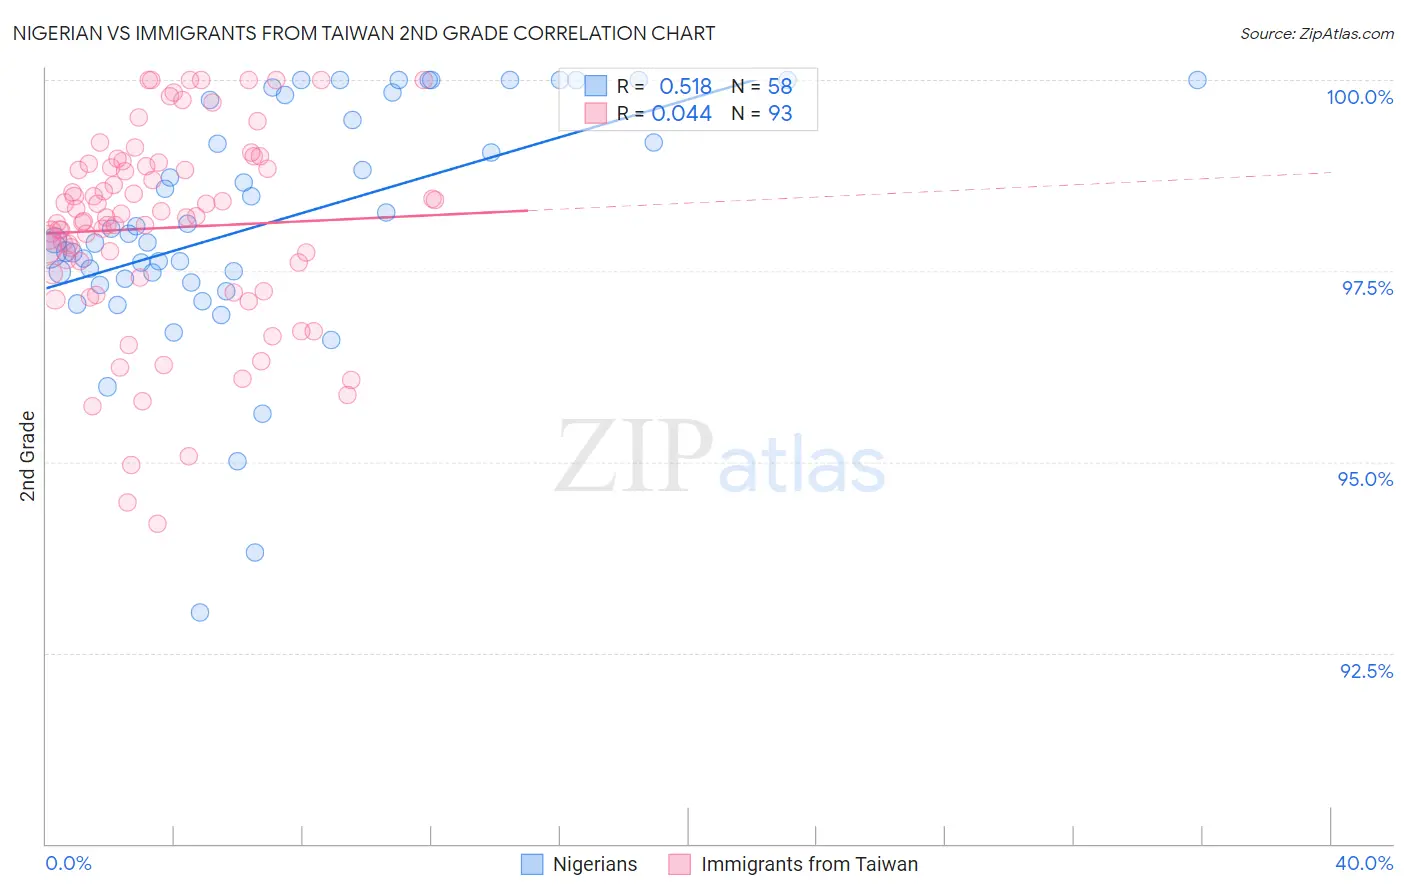
Nigerian vs Immigrants from Taiwan 2nd Grade Correlation Chart
The statistical analysis conducted on geographies consisting of 332,724,627 people shows a substantial positive correlation between the proportion of Nigerians and percentage of population with at least 2nd grade education in the United States with a correlation coefficient (R) of 0.518 and weighted average of 97.6%. Similarly, the statistical analysis conducted on geographies consisting of 298,069,082 people shows no correlation between the proportion of Immigrants from Taiwan and percentage of population with at least 2nd grade education in the United States with a correlation coefficient (R) of 0.044 and weighted average of 97.8%, a difference of 0.26%.
2nd Grade Correlation Summary
| Measurement | Nigerian | Immigrants from Taiwan |
| Minimum | 93.0% | 94.2% |
| Maximum | 100.0% | 100.0% |
| Range | 7.0% | 5.8% |
| Mean | 98.1% | 98.1% |
| Median | 97.9% | 98.2% |
| Interquartile 25% (IQ1) | 97.4% | 97.4% |
| Interquartile 75% (IQ3) | 99.7% | 98.9% |
| Interquartile Range (IQR) | 2.3% | 1.4% |
| Standard Deviation (Sample) | 1.5% | 1.3% |
| Standard Deviation (Population) | 1.5% | 1.3% |
Similar Demographics by 2nd Grade
Demographics Similar to Nigerians by 2nd Grade
In terms of 2nd grade, the demographic groups most similar to Nigerians are U.S. Virgin Islander (97.6%, a difference of 0.0%), Immigrants from Eastern Asia (97.6%, a difference of 0.0%), Liberian (97.6%, a difference of 0.0%), Immigrants from Malaysia (97.6%, a difference of 0.010%), and Colombian (97.6%, a difference of 0.010%).
| Demographics | Rating | Rank | 2nd Grade |
| Immigrants | Costa Rica | 3.1 /100 | #229 | Tragic 97.6% |
| Senegalese | 3.1 /100 | #230 | Tragic 97.6% |
| Immigrants | Pakistan | 2.3 /100 | #231 | Tragic 97.6% |
| Immigrants | Western Asia | 2.1 /100 | #232 | Tragic 97.6% |
| Immigrants | Uruguay | 2.1 /100 | #233 | Tragic 97.6% |
| Immigrants | Malaysia | 2.0 /100 | #234 | Tragic 97.6% |
| Colombians | 1.9 /100 | #235 | Tragic 97.6% |
| Nigerians | 1.7 /100 | #236 | Tragic 97.6% |
| U.S. Virgin Islanders | 1.6 /100 | #237 | Tragic 97.6% |
| Immigrants | Eastern Asia | 1.6 /100 | #238 | Tragic 97.6% |
| Liberians | 1.6 /100 | #239 | Tragic 97.6% |
| Koreans | 1.5 /100 | #240 | Tragic 97.5% |
| Ethiopians | 1.2 /100 | #241 | Tragic 97.5% |
| Immigrants | Indonesia | 1.2 /100 | #242 | Tragic 97.5% |
| Asians | 1.1 /100 | #243 | Tragic 97.5% |
Demographics Similar to Immigrants from Taiwan by 2nd Grade
In terms of 2nd grade, the demographic groups most similar to Immigrants from Taiwan are Paraguayan (97.8%, a difference of 0.0%), Immigrants from Kazakhstan (97.8%, a difference of 0.010%), Panamanian (97.8%, a difference of 0.010%), Black/African American (97.8%, a difference of 0.010%), and Hawaiian (97.8%, a difference of 0.010%).
| Demographics | Rating | Rank | 2nd Grade |
| Immigrants | Poland | 42.2 /100 | #183 | Average 97.8% |
| Immigrants | Belarus | 41.5 /100 | #184 | Average 97.8% |
| Immigrants | Argentina | 40.6 /100 | #185 | Average 97.8% |
| Arabs | 36.9 /100 | #186 | Fair 97.8% |
| Pakistanis | 36.1 /100 | #187 | Fair 97.8% |
| Immigrants | Kazakhstan | 35.6 /100 | #188 | Fair 97.8% |
| Panamanians | 33.5 /100 | #189 | Fair 97.8% |
| Immigrants | Taiwan | 31.8 /100 | #190 | Fair 97.8% |
| Paraguayans | 30.8 /100 | #191 | Fair 97.8% |
| Blacks/African Americans | 29.9 /100 | #192 | Fair 97.8% |
| Hawaiians | 28.5 /100 | #193 | Fair 97.8% |
| Paiute | 27.0 /100 | #194 | Fair 97.8% |
| Mongolians | 26.7 /100 | #195 | Fair 97.8% |
| Immigrants | Kenya | 26.4 /100 | #196 | Fair 97.8% |
| Immigrants | Uganda | 26.3 /100 | #197 | Fair 97.8% |