Immigrants from China vs Cree 6th Grade
COMPARE
Immigrants from China
Cree
6th Grade
6th Grade Comparison
Immigrants from China
Cree
96.4%
6TH GRADE
0.4/ 100
METRIC RATING
258th/ 347
METRIC RANK
97.5%
6TH GRADE
98.7/ 100
METRIC RATING
93rd/ 347
METRIC RANK
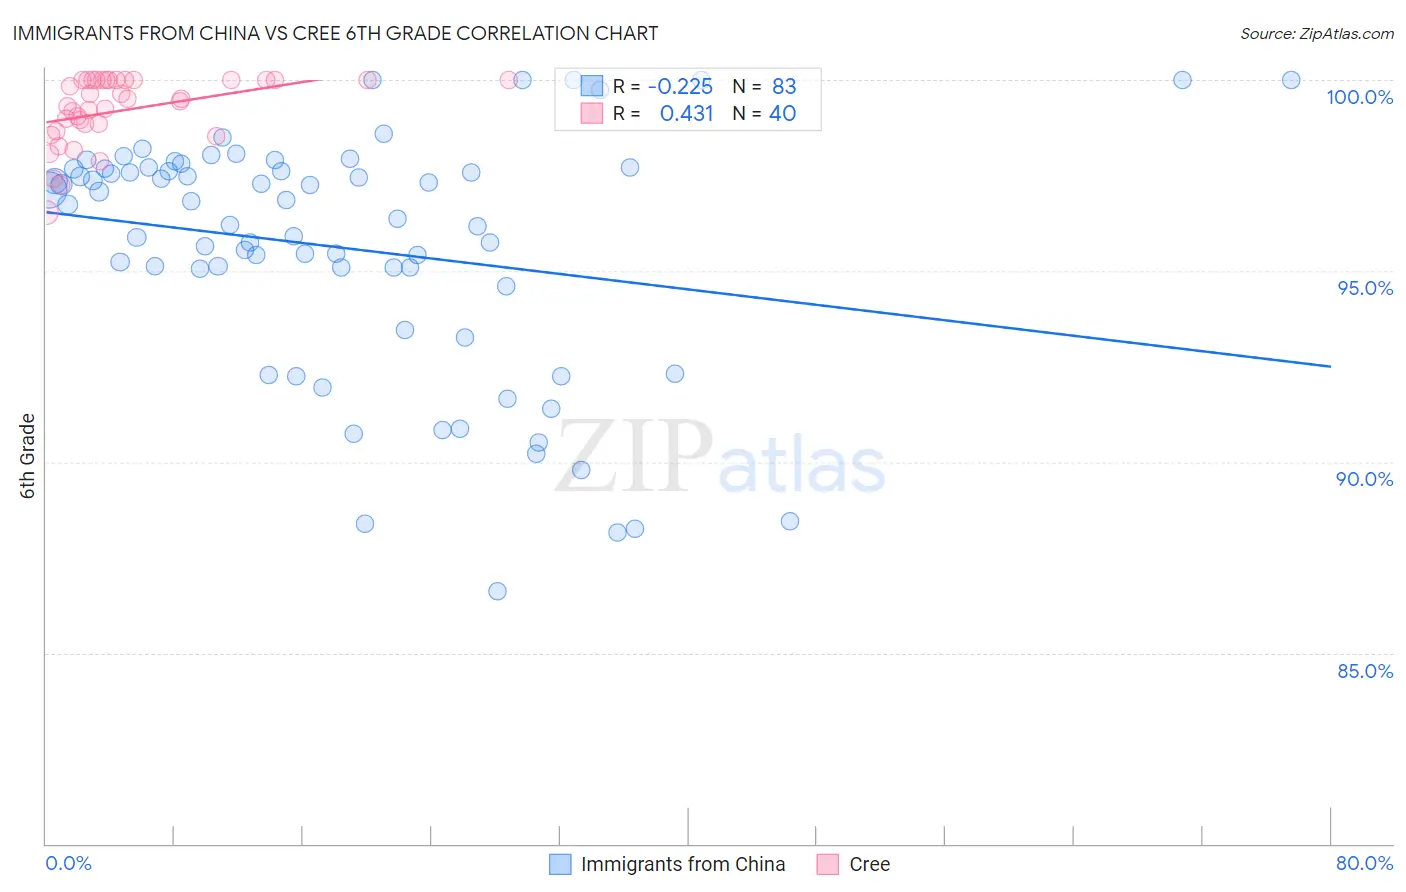
Immigrants from China vs Cree 6th Grade Correlation Chart
The statistical analysis conducted on geographies consisting of 457,082,957 people shows a weak negative correlation between the proportion of Immigrants from China and percentage of population with at least 6th grade education in the United States with a correlation coefficient (R) of -0.225 and weighted average of 96.4%. Similarly, the statistical analysis conducted on geographies consisting of 76,204,399 people shows a moderate positive correlation between the proportion of Cree and percentage of population with at least 6th grade education in the United States with a correlation coefficient (R) of 0.431 and weighted average of 97.5%, a difference of 1.1%.
6th Grade Correlation Summary
| Measurement | Immigrants from China | Cree |
| Minimum | 86.6% | 96.5% |
| Maximum | 100.0% | 100.0% |
| Range | 13.4% | 3.5% |
| Mean | 95.6% | 99.2% |
| Median | 96.7% | 99.5% |
| Interquartile 25% (IQ1) | 94.6% | 98.8% |
| Interquartile 75% (IQ3) | 97.7% | 100.0% |
| Interquartile Range (IQR) | 3.1% | 1.2% |
| Standard Deviation (Sample) | 3.2% | 0.90% |
| Standard Deviation (Population) | 3.2% | 0.89% |
Similar Demographics by 6th Grade
Demographics Similar to Immigrants from China by 6th Grade
In terms of 6th grade, the demographic groups most similar to Immigrants from China are South American (96.4%, a difference of 0.0%), Taiwanese (96.5%, a difference of 0.010%), Peruvian (96.4%, a difference of 0.010%), Immigrants from Sierra Leone (96.4%, a difference of 0.010%), and Immigrants from Ethiopia (96.5%, a difference of 0.030%).
| Demographics | Rating | Rank | 6th Grade |
| Immigrants | Senegal | 0.7 /100 | #251 | Tragic 96.5% |
| Immigrants | Uruguay | 0.6 /100 | #252 | Tragic 96.5% |
| Jamaicans | 0.6 /100 | #253 | Tragic 96.5% |
| Immigrants | Ethiopia | 0.6 /100 | #254 | Tragic 96.5% |
| Immigrants | Congo | 0.6 /100 | #255 | Tragic 96.5% |
| U.S. Virgin Islanders | 0.5 /100 | #256 | Tragic 96.5% |
| Taiwanese | 0.5 /100 | #257 | Tragic 96.5% |
| Immigrants | China | 0.4 /100 | #258 | Tragic 96.4% |
| South Americans | 0.4 /100 | #259 | Tragic 96.4% |
| Peruvians | 0.4 /100 | #260 | Tragic 96.4% |
| Immigrants | Sierra Leone | 0.4 /100 | #261 | Tragic 96.4% |
| Immigrants | Nigeria | 0.3 /100 | #262 | Tragic 96.4% |
| Immigrants | Colombia | 0.3 /100 | #263 | Tragic 96.4% |
| Armenians | 0.3 /100 | #264 | Tragic 96.4% |
| Immigrants | Jamaica | 0.2 /100 | #265 | Tragic 96.4% |
Demographics Similar to Cree by 6th Grade
In terms of 6th grade, the demographic groups most similar to Cree are Romanian (97.5%, a difference of 0.0%), Cypriot (97.5%, a difference of 0.0%), Immigrants from Ireland (97.5%, a difference of 0.0%), Immigrants from Germany (97.5%, a difference of 0.0%), and Immigrants from Sweden (97.5%, a difference of 0.0%).
| Demographics | Rating | Rank | 6th Grade |
| Immigrants | Belgium | 98.9 /100 | #86 | Exceptional 97.5% |
| Puget Sound Salish | 98.9 /100 | #87 | Exceptional 97.5% |
| Immigrants | South Africa | 98.9 /100 | #88 | Exceptional 97.5% |
| Immigrants | Australia | 98.8 /100 | #89 | Exceptional 97.5% |
| Pueblo | 98.8 /100 | #90 | Exceptional 97.5% |
| Immigrants | Western Europe | 98.8 /100 | #91 | Exceptional 97.5% |
| Romanians | 98.7 /100 | #92 | Exceptional 97.5% |
| Cree | 98.7 /100 | #93 | Exceptional 97.5% |
| Cypriots | 98.7 /100 | #94 | Exceptional 97.5% |
| Immigrants | Ireland | 98.7 /100 | #95 | Exceptional 97.5% |
| Immigrants | Germany | 98.6 /100 | #96 | Exceptional 97.5% |
| Immigrants | Sweden | 98.6 /100 | #97 | Exceptional 97.5% |
| Immigrants | Denmark | 98.5 /100 | #98 | Exceptional 97.5% |
| Yugoslavians | 98.5 /100 | #99 | Exceptional 97.5% |
| Turks | 98.3 /100 | #100 | Exceptional 97.5% |