Immigrants from Taiwan vs Pima 5th Grade
COMPARE
Immigrants from Taiwan
Pima
5th Grade
5th Grade Comparison
Immigrants from Taiwan
Pima
97.3%
5TH GRADE
48.4/ 100
METRIC RATING
176th/ 347
METRIC RANK
97.6%
5TH GRADE
91.2/ 100
METRIC RATING
131st/ 347
METRIC RANK
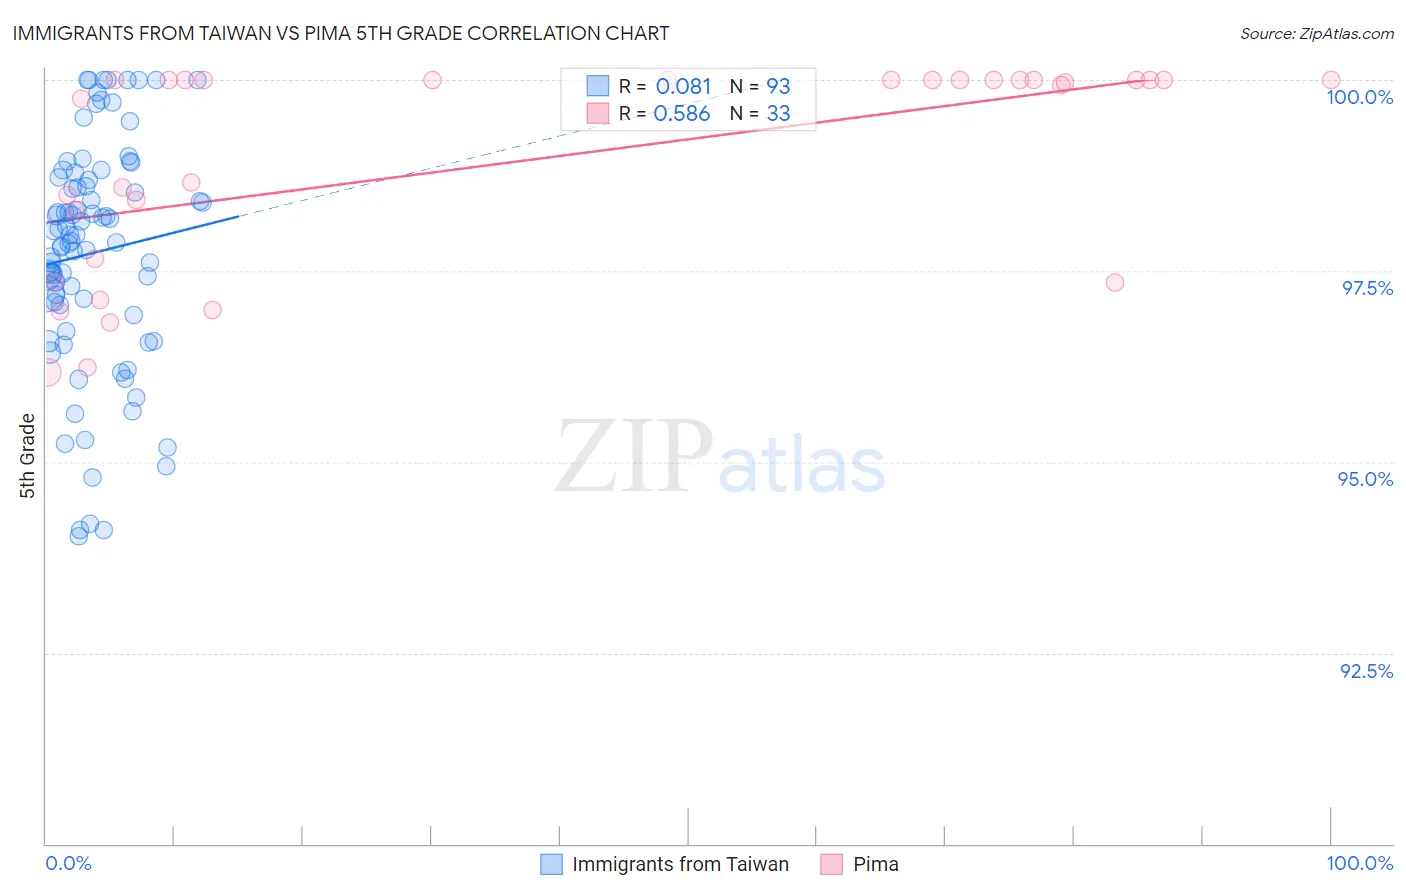
Immigrants from Taiwan vs Pima 5th Grade Correlation Chart
The statistical analysis conducted on geographies consisting of 298,069,082 people shows a slight positive correlation between the proportion of Immigrants from Taiwan and percentage of population with at least 5th grade education in the United States with a correlation coefficient (R) of 0.081 and weighted average of 97.3%. Similarly, the statistical analysis conducted on geographies consisting of 61,552,136 people shows a substantial positive correlation between the proportion of Pima and percentage of population with at least 5th grade education in the United States with a correlation coefficient (R) of 0.586 and weighted average of 97.6%, a difference of 0.25%.
5th Grade Correlation Summary
| Measurement | Immigrants from Taiwan | Pima |
| Minimum | 94.0% | 96.2% |
| Maximum | 100.0% | 100.0% |
| Range | 6.0% | 3.8% |
| Mean | 97.7% | 98.9% |
| Median | 98.0% | 100.0% |
| Interquartile 25% (IQ1) | 97.0% | 97.5% |
| Interquartile 75% (IQ3) | 98.7% | 100.0% |
| Interquartile Range (IQR) | 1.7% | 2.5% |
| Standard Deviation (Sample) | 1.5% | 1.4% |
| Standard Deviation (Population) | 1.5% | 1.3% |
Similar Demographics by 5th Grade
Demographics Similar to Immigrants from Taiwan by 5th Grade
In terms of 5th grade, the demographic groups most similar to Immigrants from Taiwan are Immigrants from Micronesia (97.3%, a difference of 0.0%), Immigrants from Kazakhstan (97.3%, a difference of 0.010%), Immigrants from Spain (97.3%, a difference of 0.010%), Immigrants from Korea (97.3%, a difference of 0.020%), and Venezuelan (97.3%, a difference of 0.020%).
| Demographics | Rating | Rank | 5th Grade |
| Immigrants | Korea | 54.1 /100 | #169 | Average 97.3% |
| Venezuelans | 54.0 /100 | #170 | Average 97.3% |
| Immigrants | Sri Lanka | 53.8 /100 | #171 | Average 97.3% |
| Arabs | 53.4 /100 | #172 | Average 97.3% |
| Egyptians | 52.4 /100 | #173 | Average 97.3% |
| Immigrants | Kazakhstan | 50.0 /100 | #174 | Average 97.3% |
| Immigrants | Micronesia | 48.8 /100 | #175 | Average 97.3% |
| Immigrants | Taiwan | 48.4 /100 | #176 | Average 97.3% |
| Immigrants | Spain | 47.0 /100 | #177 | Average 97.3% |
| Comanche | 42.1 /100 | #178 | Average 97.3% |
| Immigrants | Kenya | 40.3 /100 | #179 | Average 97.3% |
| Pakistanis | 40.2 /100 | #180 | Average 97.3% |
| Argentineans | 39.5 /100 | #181 | Fair 97.3% |
| Mongolians | 39.4 /100 | #182 | Fair 97.3% |
| Immigrants | Ukraine | 38.6 /100 | #183 | Fair 97.3% |
Demographics Similar to Pima by 5th Grade
In terms of 5th grade, the demographic groups most similar to Pima are Immigrants from Serbia (97.6%, a difference of 0.010%), Colville (97.6%, a difference of 0.010%), Immigrants from Europe (97.6%, a difference of 0.010%), Immigrants from Romania (97.6%, a difference of 0.010%), and Immigrants from Kuwait (97.6%, a difference of 0.010%).
| Demographics | Rating | Rank | 5th Grade |
| Spanish | 93.7 /100 | #124 | Exceptional 97.6% |
| Immigrants | Bulgaria | 93.1 /100 | #125 | Exceptional 97.6% |
| Hmong | 92.3 /100 | #126 | Exceptional 97.6% |
| Immigrants | Serbia | 92.3 /100 | #127 | Exceptional 97.6% |
| Colville | 92.0 /100 | #128 | Exceptional 97.6% |
| Immigrants | Europe | 91.9 /100 | #129 | Exceptional 97.6% |
| Immigrants | Romania | 91.6 /100 | #130 | Exceptional 97.6% |
| Pima | 91.2 /100 | #131 | Exceptional 97.6% |
| Immigrants | Kuwait | 90.4 /100 | #132 | Exceptional 97.6% |
| Cambodians | 90.2 /100 | #133 | Exceptional 97.6% |
| Immigrants | Hungary | 90.1 /100 | #134 | Exceptional 97.6% |
| Palestinians | 89.3 /100 | #135 | Excellent 97.5% |
| Immigrants | Moldova | 87.5 /100 | #136 | Excellent 97.5% |
| Filipinos | 86.8 /100 | #137 | Excellent 97.5% |
| Blackfeet | 86.8 /100 | #138 | Excellent 97.5% |