New Zealander vs Immigrants from Australia Professional Degree
COMPARE
New Zealander
Immigrants from Australia
Professional Degree
Professional Degree Comparison
New Zealanders
Immigrants from Australia
6.0%
PROFESSIONAL DEGREE
100.0/ 100
METRIC RATING
41st/ 347
METRIC RANK
6.9%
PROFESSIONAL DEGREE
100.0/ 100
METRIC RATING
13th/ 347
METRIC RANK
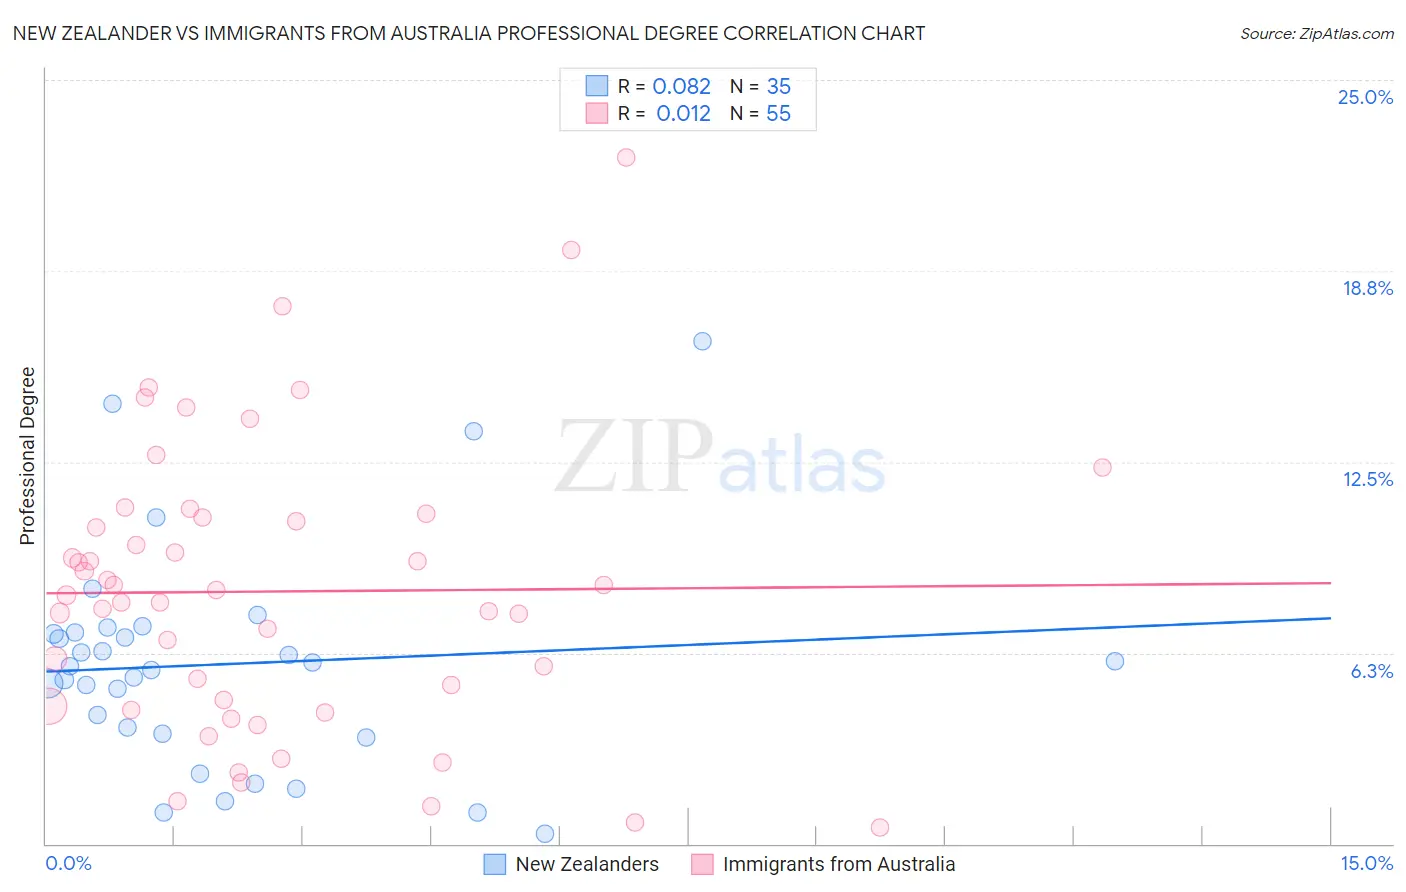
New Zealander vs Immigrants from Australia Professional Degree Correlation Chart
The statistical analysis conducted on geographies consisting of 106,863,101 people shows a slight positive correlation between the proportion of New Zealanders and percentage of population with at least professional degree education in the United States with a correlation coefficient (R) of 0.082 and weighted average of 6.0%. Similarly, the statistical analysis conducted on geographies consisting of 227,049,899 people shows no correlation between the proportion of Immigrants from Australia and percentage of population with at least professional degree education in the United States with a correlation coefficient (R) of 0.012 and weighted average of 6.9%, a difference of 15.9%.
Professional Degree Correlation Summary
| Measurement | New Zealander | Immigrants from Australia |
| Minimum | 0.31% | 0.53% |
| Maximum | 16.5% | 22.5% |
| Range | 16.1% | 21.9% |
| Mean | 5.9% | 8.3% |
| Median | 5.8% | 8.1% |
| Interquartile 25% (IQ1) | 3.6% | 4.5% |
| Interquartile 75% (IQ3) | 6.9% | 10.7% |
| Interquartile Range (IQR) | 3.3% | 6.2% |
| Standard Deviation (Sample) | 3.6% | 4.7% |
| Standard Deviation (Population) | 3.6% | 4.7% |
Similar Demographics by Professional Degree
Demographics Similar to New Zealanders by Professional Degree
In terms of professional degree, the demographic groups most similar to New Zealanders are Estonian (6.0%, a difference of 0.010%), Cambodian (6.0%, a difference of 0.18%), Immigrants from Saudi Arabia (5.9%, a difference of 0.33%), Argentinean (5.9%, a difference of 0.49%), and Immigrants from South Africa (6.0%, a difference of 0.66%).
| Demographics | Rating | Rank | Professional Degree |
| Mongolians | 100.0 /100 | #34 | Exceptional 6.1% |
| Immigrants | Korea | 100.0 /100 | #35 | Exceptional 6.1% |
| Immigrants | Russia | 100.0 /100 | #36 | Exceptional 6.0% |
| Immigrants | Austria | 100.0 /100 | #37 | Exceptional 6.0% |
| Immigrants | Norway | 100.0 /100 | #38 | Exceptional 6.0% |
| Immigrants | South Africa | 100.0 /100 | #39 | Exceptional 6.0% |
| Cambodians | 100.0 /100 | #40 | Exceptional 6.0% |
| New Zealanders | 100.0 /100 | #41 | Exceptional 6.0% |
| Estonians | 100.0 /100 | #42 | Exceptional 6.0% |
| Immigrants | Saudi Arabia | 100.0 /100 | #43 | Exceptional 5.9% |
| Argentineans | 100.0 /100 | #44 | Exceptional 5.9% |
| Immigrants | South Central Asia | 100.0 /100 | #45 | Exceptional 5.9% |
| Immigrants | Argentina | 100.0 /100 | #46 | Exceptional 5.9% |
| Australians | 100.0 /100 | #47 | Exceptional 5.9% |
| Paraguayans | 100.0 /100 | #48 | Exceptional 5.9% |
Demographics Similar to Immigrants from Australia by Professional Degree
In terms of professional degree, the demographic groups most similar to Immigrants from Australia are Israeli (6.9%, a difference of 0.43%), Cypriot (6.9%, a difference of 0.49%), Immigrants from Belgium (7.0%, a difference of 0.66%), Immigrants from France (6.8%, a difference of 1.5%), and Immigrants from Taiwan (7.1%, a difference of 2.4%).
| Demographics | Rating | Rank | Professional Degree |
| Okinawans | 100.0 /100 | #6 | Exceptional 7.3% |
| Eastern Europeans | 100.0 /100 | #7 | Exceptional 7.1% |
| Immigrants | Switzerland | 100.0 /100 | #8 | Exceptional 7.1% |
| Immigrants | Taiwan | 100.0 /100 | #9 | Exceptional 7.1% |
| Immigrants | Belgium | 100.0 /100 | #10 | Exceptional 7.0% |
| Cypriots | 100.0 /100 | #11 | Exceptional 6.9% |
| Israelis | 100.0 /100 | #12 | Exceptional 6.9% |
| Immigrants | Australia | 100.0 /100 | #13 | Exceptional 6.9% |
| Immigrants | France | 100.0 /100 | #14 | Exceptional 6.8% |
| Immigrants | China | 100.0 /100 | #15 | Exceptional 6.7% |
| Immigrants | Sweden | 100.0 /100 | #16 | Exceptional 6.7% |
| Immigrants | Eastern Asia | 100.0 /100 | #17 | Exceptional 6.6% |
| Soviet Union | 100.0 /100 | #18 | Exceptional 6.6% |
| Indians (Asian) | 100.0 /100 | #19 | Exceptional 6.5% |
| Immigrants | Denmark | 100.0 /100 | #20 | Exceptional 6.4% |