Nepalese vs Cree 11th Grade
COMPARE
Nepalese
Cree
11th Grade
11th Grade Comparison
Nepalese
Cree
89.5%
11TH GRADE
0.0/ 100
METRIC RATING
308th/ 347
METRIC RANK
92.9%
11TH GRADE
85.9/ 100
METRIC RATING
136th/ 347
METRIC RANK
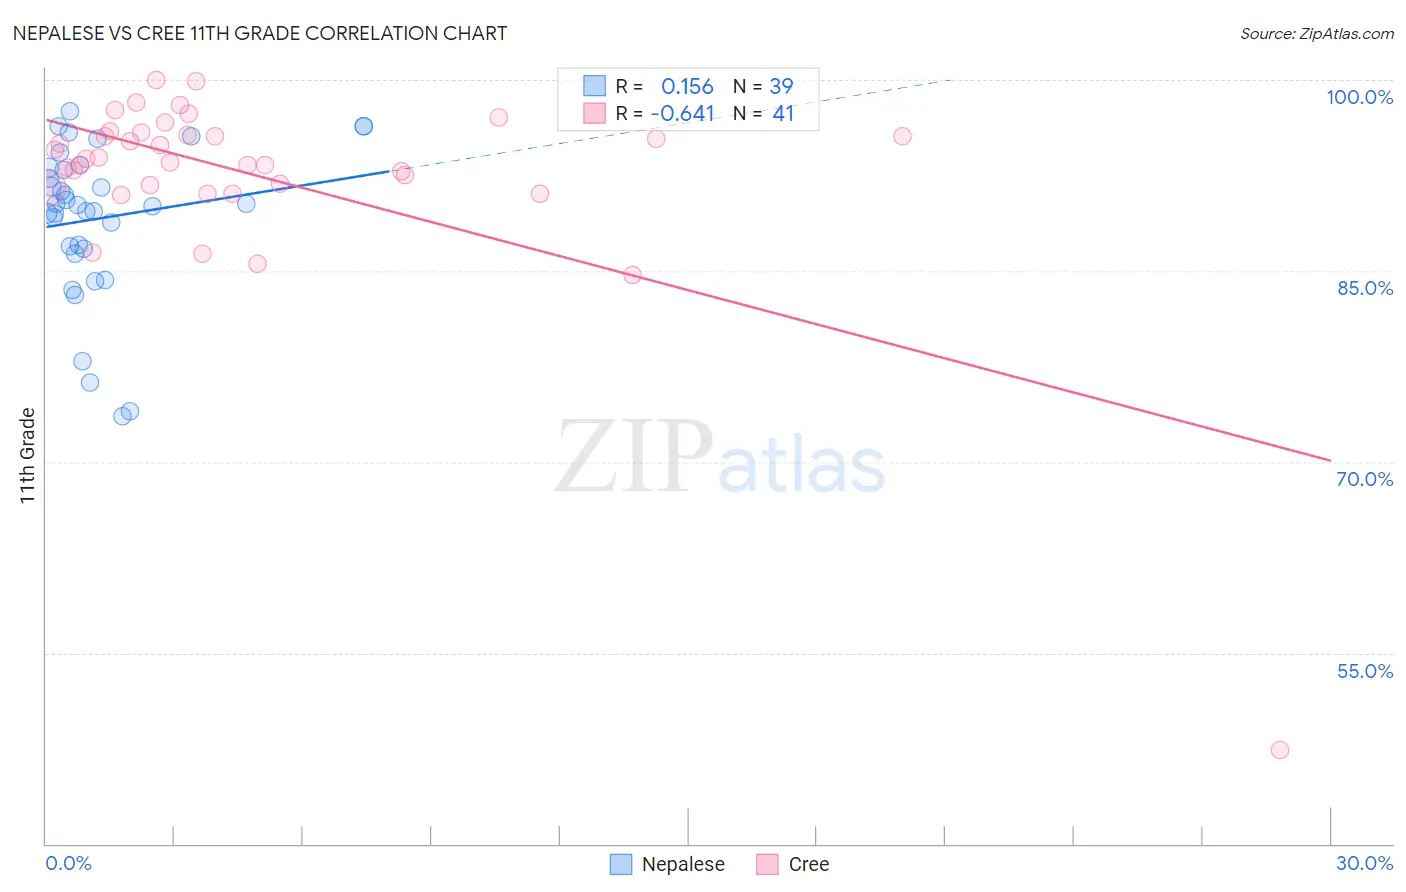
Nepalese vs Cree 11th Grade Correlation Chart
The statistical analysis conducted on geographies consisting of 24,519,269 people shows a poor positive correlation between the proportion of Nepalese and percentage of population with at least 11th grade education in the United States with a correlation coefficient (R) of 0.156 and weighted average of 89.5%. Similarly, the statistical analysis conducted on geographies consisting of 76,211,744 people shows a significant negative correlation between the proportion of Cree and percentage of population with at least 11th grade education in the United States with a correlation coefficient (R) of -0.641 and weighted average of 92.9%, a difference of 3.8%.
11th Grade Correlation Summary
| Measurement | Nepalese | Cree |
| Minimum | 73.6% | 47.4% |
| Maximum | 97.6% | 100.0% |
| Range | 24.0% | 52.6% |
| Mean | 89.1% | 92.6% |
| Median | 90.1% | 93.8% |
| Interquartile 25% (IQ1) | 86.7% | 91.6% |
| Interquartile 75% (IQ3) | 93.1% | 95.8% |
| Interquartile Range (IQR) | 6.4% | 4.2% |
| Standard Deviation (Sample) | 6.0% | 8.1% |
| Standard Deviation (Population) | 5.9% | 8.0% |
Similar Demographics by 11th Grade
Demographics Similar to Nepalese by 11th Grade
In terms of 11th grade, the demographic groups most similar to Nepalese are Immigrants from Dominica (89.5%, a difference of 0.020%), Immigrants from Bangladesh (89.5%, a difference of 0.020%), Yaqui (89.5%, a difference of 0.030%), Ecuadorian (89.6%, a difference of 0.070%), and Vietnamese (89.4%, a difference of 0.10%).
| Demographics | Rating | Rank | 11th Grade |
| Guyanese | 0.0 /100 | #301 | Tragic 89.9% |
| Immigrants | Guyana | 0.0 /100 | #302 | Tragic 89.7% |
| Immigrants | Immigrants | 0.0 /100 | #303 | Tragic 89.7% |
| Yuman | 0.0 /100 | #304 | Tragic 89.7% |
| Immigrants | Cambodia | 0.0 /100 | #305 | Tragic 89.6% |
| Ecuadorians | 0.0 /100 | #306 | Tragic 89.6% |
| Immigrants | Dominica | 0.0 /100 | #307 | Tragic 89.5% |
| Nepalese | 0.0 /100 | #308 | Tragic 89.5% |
| Immigrants | Bangladesh | 0.0 /100 | #309 | Tragic 89.5% |
| Yaqui | 0.0 /100 | #310 | Tragic 89.5% |
| Vietnamese | 0.0 /100 | #311 | Tragic 89.4% |
| Immigrants | Portugal | 0.0 /100 | #312 | Tragic 89.3% |
| Immigrants | Caribbean | 0.0 /100 | #313 | Tragic 89.1% |
| Cape Verdeans | 0.0 /100 | #314 | Tragic 89.1% |
| Immigrants | Ecuador | 0.0 /100 | #315 | Tragic 89.1% |
Demographics Similar to Cree by 11th Grade
In terms of 11th grade, the demographic groups most similar to Cree are Immigrants from Italy (92.9%, a difference of 0.010%), Arab (92.9%, a difference of 0.010%), Immigrants from Brazil (92.9%, a difference of 0.020%), Mongolian (93.0%, a difference of 0.030%), and Delaware (93.0%, a difference of 0.030%).
| Demographics | Rating | Rank | 11th Grade |
| Immigrants | Ukraine | 89.8 /100 | #129 | Excellent 93.0% |
| Albanians | 89.5 /100 | #130 | Excellent 93.0% |
| Egyptians | 89.5 /100 | #131 | Excellent 93.0% |
| Immigrants | Bosnia and Herzegovina | 89.0 /100 | #132 | Excellent 93.0% |
| Mongolians | 87.6 /100 | #133 | Excellent 93.0% |
| Delaware | 87.3 /100 | #134 | Excellent 93.0% |
| Immigrants | Italy | 86.6 /100 | #135 | Excellent 92.9% |
| Cree | 85.9 /100 | #136 | Excellent 92.9% |
| Arabs | 85.4 /100 | #137 | Excellent 92.9% |
| Immigrants | Brazil | 85.1 /100 | #138 | Excellent 92.9% |
| Crow | 84.1 /100 | #139 | Excellent 92.9% |
| Venezuelans | 83.4 /100 | #140 | Excellent 92.9% |
| Chileans | 83.0 /100 | #141 | Excellent 92.9% |
| Kenyans | 82.0 /100 | #142 | Excellent 92.9% |
| Ugandans | 81.4 /100 | #143 | Excellent 92.9% |