Trinidadian and Tobagonian vs Immigrants from Congo 5th Grade
COMPARE
Trinidadian and Tobagonian
Immigrants from Congo
5th Grade
5th Grade Comparison
Trinidadians and Tobagonians
Immigrants from Congo
96.7%
5TH GRADE
0.1/ 100
METRIC RATING
272nd/ 347
METRIC RANK
96.8%
5TH GRADE
0.7/ 100
METRIC RATING
256th/ 347
METRIC RANK
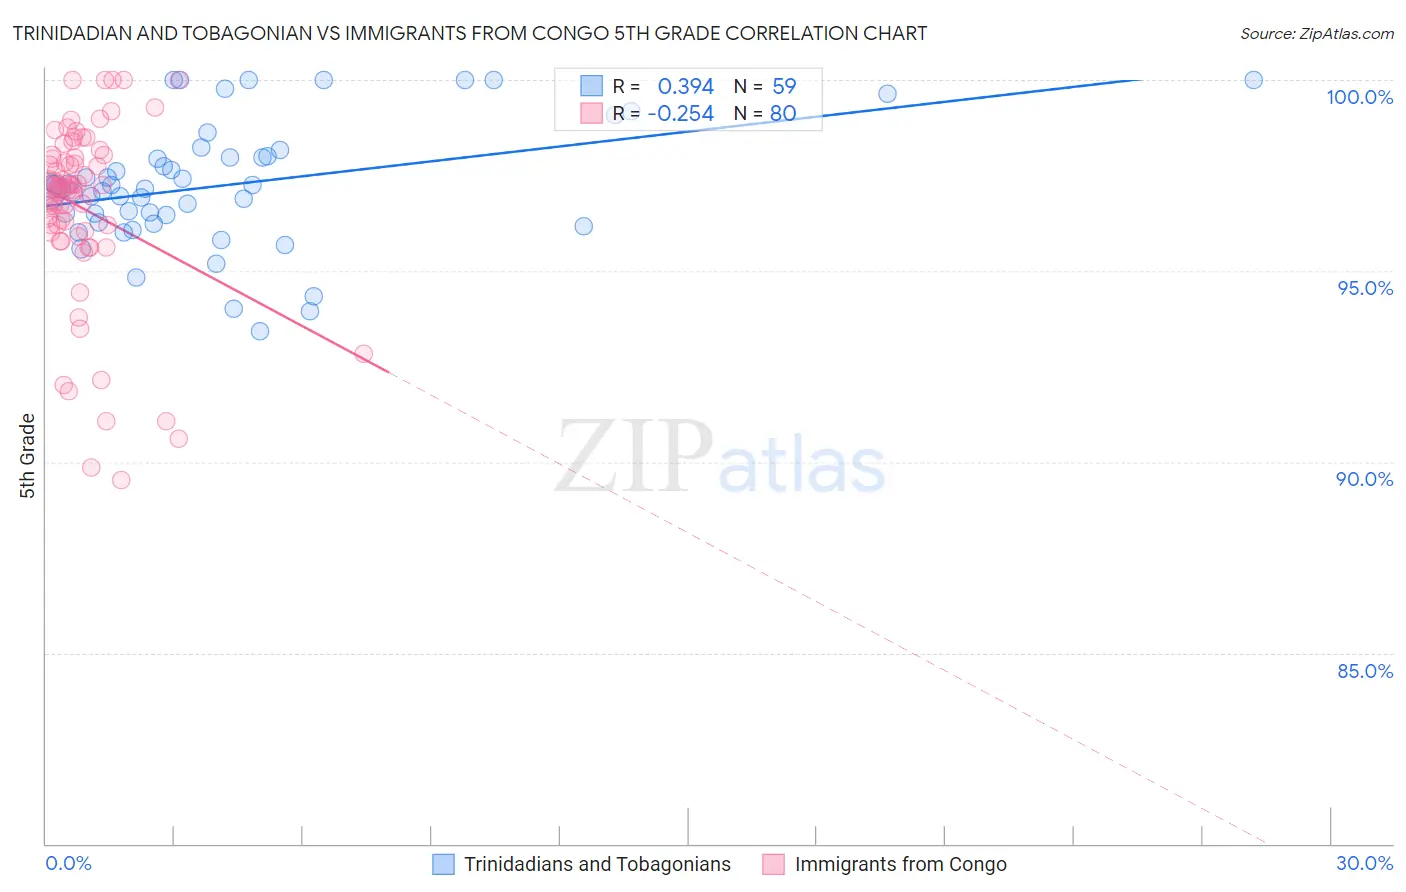
Trinidadian and Tobagonian vs Immigrants from Congo 5th Grade Correlation Chart
The statistical analysis conducted on geographies consisting of 219,882,819 people shows a mild positive correlation between the proportion of Trinidadians and Tobagonians and percentage of population with at least 5th grade education in the United States with a correlation coefficient (R) of 0.394 and weighted average of 96.7%. Similarly, the statistical analysis conducted on geographies consisting of 92,124,753 people shows a weak negative correlation between the proportion of Immigrants from Congo and percentage of population with at least 5th grade education in the United States with a correlation coefficient (R) of -0.254 and weighted average of 96.8%, a difference of 0.16%.
5th Grade Correlation Summary
| Measurement | Trinidadian and Tobagonian | Immigrants from Congo |
| Minimum | 93.4% | 89.5% |
| Maximum | 100.0% | 100.0% |
| Range | 6.6% | 10.5% |
| Mean | 97.3% | 96.6% |
| Median | 97.2% | 97.2% |
| Interquartile 25% (IQ1) | 96.3% | 96.0% |
| Interquartile 75% (IQ3) | 98.0% | 98.0% |
| Interquartile Range (IQR) | 1.7% | 2.0% |
| Standard Deviation (Sample) | 1.6% | 2.4% |
| Standard Deviation (Population) | 1.6% | 2.3% |
Demographics Similar to Trinidadians and Tobagonians and Immigrants from Congo by 5th Grade
In terms of 5th grade, the demographic groups most similar to Trinidadians and Tobagonians are Immigrants from Hong Kong (96.7%, a difference of 0.010%), Yaqui (96.7%, a difference of 0.010%), Immigrants from Cameroon (96.7%, a difference of 0.010%), Afghan (96.7%, a difference of 0.020%), and Ghanaian (96.7%, a difference of 0.060%). Similarly, the demographic groups most similar to Immigrants from Congo are South American (96.8%, a difference of 0.0%), Peruvian (96.8%, a difference of 0.0%), Immigrants from Senegal (96.8%, a difference of 0.020%), Immigrants from Ethiopia (96.8%, a difference of 0.030%), and Immigrants from China (96.8%, a difference of 0.040%).
| Demographics | Rating | Rank | 5th Grade |
| Immigrants | Senegal | 0.8 /100 | #254 | Tragic 96.8% |
| South Americans | 0.7 /100 | #255 | Tragic 96.8% |
| Immigrants | Congo | 0.7 /100 | #256 | Tragic 96.8% |
| Peruvians | 0.6 /100 | #257 | Tragic 96.8% |
| Immigrants | Ethiopia | 0.5 /100 | #258 | Tragic 96.8% |
| Immigrants | China | 0.5 /100 | #259 | Tragic 96.8% |
| Immigrants | Jamaica | 0.4 /100 | #260 | Tragic 96.8% |
| Immigrants | Sierra Leone | 0.4 /100 | #261 | Tragic 96.8% |
| Immigrants | Colombia | 0.4 /100 | #262 | Tragic 96.8% |
| Immigrants | Uzbekistan | 0.3 /100 | #263 | Tragic 96.8% |
| West Indians | 0.3 /100 | #264 | Tragic 96.8% |
| Taiwanese | 0.3 /100 | #265 | Tragic 96.7% |
| Immigrants | Nigeria | 0.3 /100 | #266 | Tragic 96.7% |
| Immigrants | South America | 0.3 /100 | #267 | Tragic 96.7% |
| Armenians | 0.3 /100 | #268 | Tragic 96.7% |
| Ghanaians | 0.2 /100 | #269 | Tragic 96.7% |
| Afghans | 0.2 /100 | #270 | Tragic 96.7% |
| Immigrants | Hong Kong | 0.2 /100 | #271 | Tragic 96.7% |
| Trinidadians and Tobagonians | 0.1 /100 | #272 | Tragic 96.7% |
| Yaqui | 0.1 /100 | #273 | Tragic 96.7% |
| Immigrants | Cameroon | 0.1 /100 | #274 | Tragic 96.7% |