Navajo vs Chilean 12th Grade, No Diploma
COMPARE
Navajo
Chilean
12th Grade, No Diploma
12th Grade, No Diploma Comparison
Navajo
Chileans
87.1%
12TH GRADE, NO DIPLOMA
0.0/ 100
METRIC RATING
317th/ 347
METRIC RANK
91.7%
12TH GRADE, NO DIPLOMA
85.8/ 100
METRIC RATING
136th/ 347
METRIC RANK
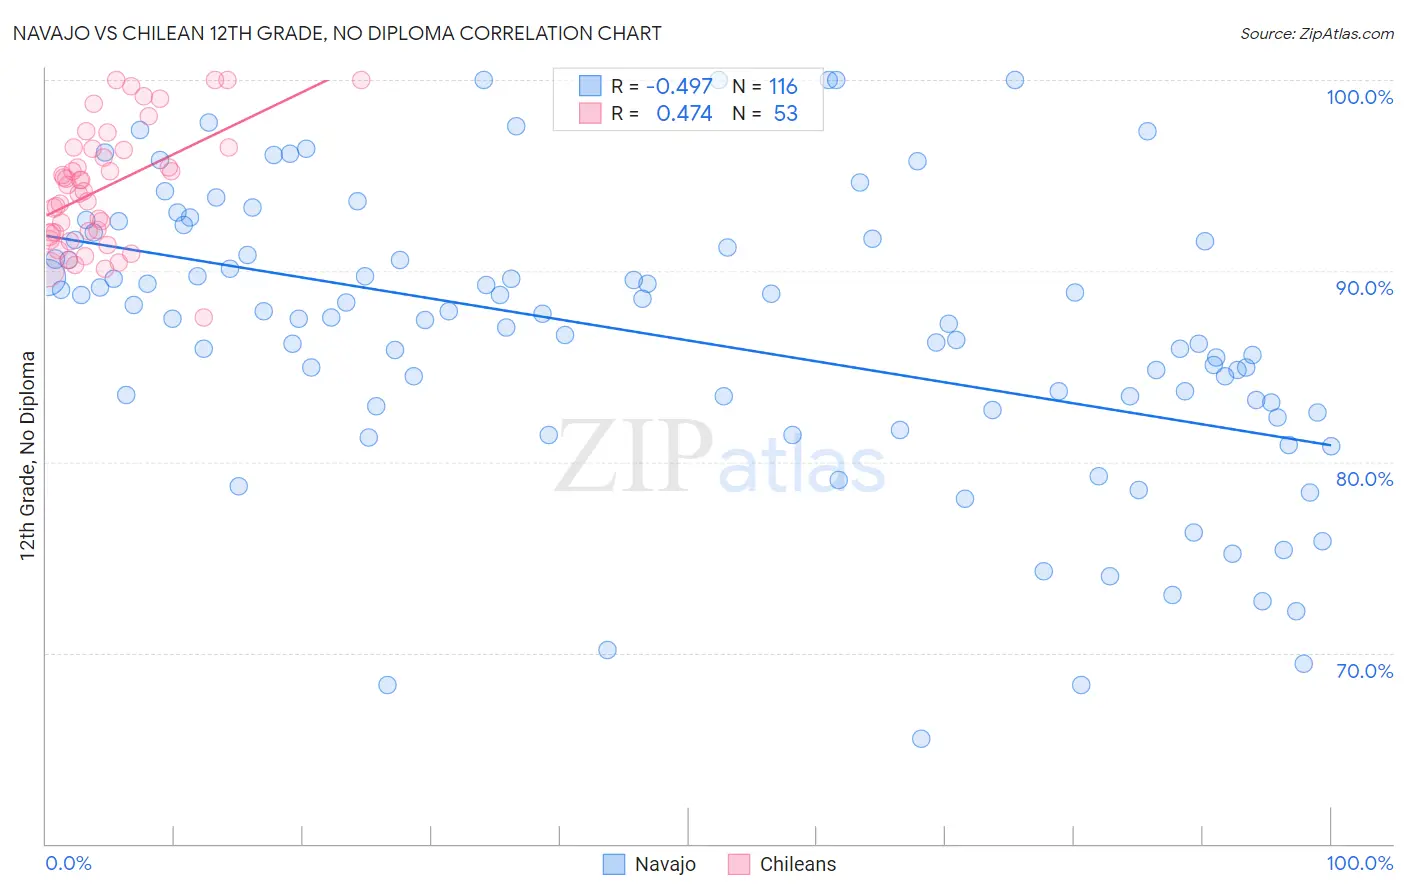
Navajo vs Chilean 12th Grade, No Diploma Correlation Chart
The statistical analysis conducted on geographies consisting of 224,872,856 people shows a moderate negative correlation between the proportion of Navajo and percentage of population with at least 12th grade (no diploma) education in the United States with a correlation coefficient (R) of -0.497 and weighted average of 87.1%. Similarly, the statistical analysis conducted on geographies consisting of 256,681,007 people shows a moderate positive correlation between the proportion of Chileans and percentage of population with at least 12th grade (no diploma) education in the United States with a correlation coefficient (R) of 0.474 and weighted average of 91.7%, a difference of 5.3%.
12th Grade, No Diploma Correlation Summary
| Measurement | Navajo | Chilean |
| Minimum | 65.5% | 87.6% |
| Maximum | 100.0% | 100.0% |
| Range | 34.5% | 12.4% |
| Mean | 86.6% | 94.4% |
| Median | 87.5% | 94.5% |
| Interquartile 25% (IQ1) | 82.8% | 91.9% |
| Interquartile 75% (IQ3) | 91.4% | 96.4% |
| Interquartile Range (IQR) | 8.6% | 4.5% |
| Standard Deviation (Sample) | 7.5% | 3.1% |
| Standard Deviation (Population) | 7.5% | 3.1% |
Similar Demographics by 12th Grade, No Diploma
Demographics Similar to Navajo by 12th Grade, No Diploma
In terms of 12th grade, no diploma, the demographic groups most similar to Navajo are Belizean (87.0%, a difference of 0.060%), Immigrants from Belize (87.0%, a difference of 0.14%), Apache (87.3%, a difference of 0.28%), Nicaraguan (87.3%, a difference of 0.30%), and Cape Verdean (87.4%, a difference of 0.33%).
| Demographics | Rating | Rank | 12th Grade, No Diploma |
| Immigrants | Cuba | 0.0 /100 | #310 | Tragic 87.5% |
| Yaqui | 0.0 /100 | #311 | Tragic 87.5% |
| Immigrants | Ecuador | 0.0 /100 | #312 | Tragic 87.5% |
| Immigrants | Caribbean | 0.0 /100 | #313 | Tragic 87.4% |
| Cape Verdeans | 0.0 /100 | #314 | Tragic 87.4% |
| Nicaraguans | 0.0 /100 | #315 | Tragic 87.3% |
| Apache | 0.0 /100 | #316 | Tragic 87.3% |
| Navajo | 0.0 /100 | #317 | Tragic 87.1% |
| Belizeans | 0.0 /100 | #318 | Tragic 87.0% |
| Immigrants | Belize | 0.0 /100 | #319 | Tragic 87.0% |
| Immigrants | Nicaragua | 0.0 /100 | #320 | Tragic 86.6% |
| Puerto Ricans | 0.0 /100 | #321 | Tragic 86.5% |
| Central American Indians | 0.0 /100 | #322 | Tragic 86.5% |
| Yuman | 0.0 /100 | #323 | Tragic 86.5% |
| Immigrants | Cabo Verde | 0.0 /100 | #324 | Tragic 85.8% |
Demographics Similar to Chileans by 12th Grade, No Diploma
In terms of 12th grade, no diploma, the demographic groups most similar to Chileans are Alaska Native (91.6%, a difference of 0.020%), Immigrants from Bosnia and Herzegovina (91.7%, a difference of 0.040%), Arab (91.6%, a difference of 0.040%), Immigrants from Egypt (91.6%, a difference of 0.050%), and Venezuelan (91.7%, a difference of 0.060%).
| Demographics | Rating | Rank | 12th Grade, No Diploma |
| German Russians | 89.8 /100 | #129 | Excellent 91.8% |
| Assyrians/Chaldeans/Syriacs | 89.6 /100 | #130 | Excellent 91.8% |
| Albanians | 89.3 /100 | #131 | Excellent 91.8% |
| Immigrants | Eastern Asia | 89.3 /100 | #132 | Excellent 91.8% |
| Immigrants | Italy | 88.3 /100 | #133 | Excellent 91.7% |
| Venezuelans | 88.2 /100 | #134 | Excellent 91.7% |
| Immigrants | Bosnia and Herzegovina | 87.3 /100 | #135 | Excellent 91.7% |
| Chileans | 85.8 /100 | #136 | Excellent 91.7% |
| Alaska Natives | 84.9 /100 | #137 | Excellent 91.6% |
| Arabs | 84.1 /100 | #138 | Excellent 91.6% |
| Immigrants | Egypt | 83.9 /100 | #139 | Excellent 91.6% |
| Immigrants | Poland | 82.3 /100 | #140 | Excellent 91.6% |
| Argentineans | 82.0 /100 | #141 | Excellent 91.6% |
| Immigrants | Venezuela | 80.9 /100 | #142 | Excellent 91.6% |
| Immigrants | Argentina | 80.7 /100 | #143 | Excellent 91.6% |