Navajo vs Finnish 7th Grade
COMPARE
Navajo
Finnish
7th Grade
7th Grade Comparison
Navajo
Finns
95.8%
7TH GRADE
17.0/ 100
METRIC RATING
207th/ 347
METRIC RANK
98.5%
7TH GRADE
100.0/ 100
METRIC RATING
2nd/ 347
METRIC RANK
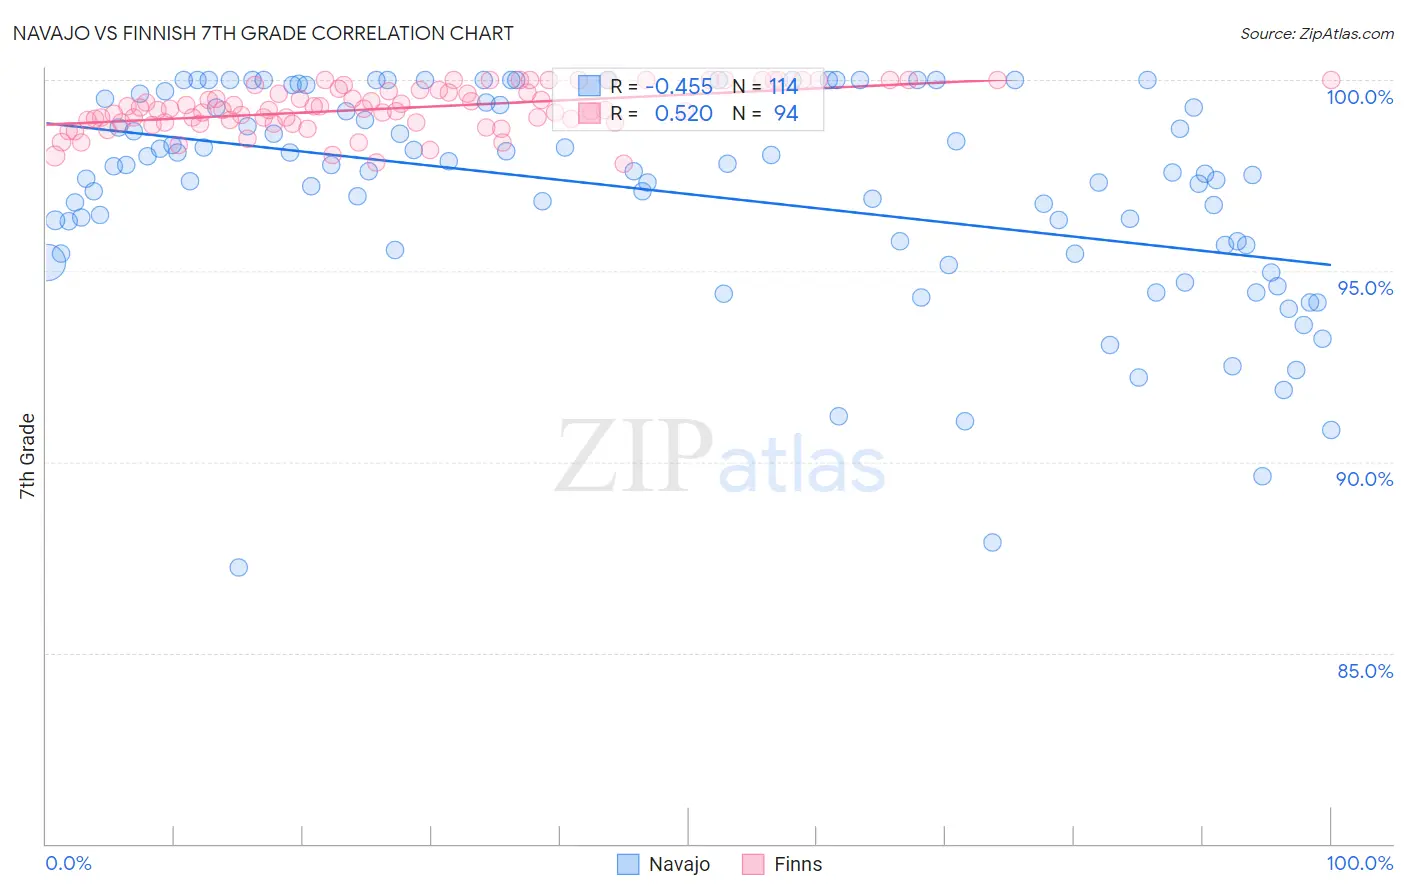
Navajo vs Finnish 7th Grade Correlation Chart
The statistical analysis conducted on geographies consisting of 224,871,965 people shows a moderate negative correlation between the proportion of Navajo and percentage of population with at least 7th grade education in the United States with a correlation coefficient (R) of -0.455 and weighted average of 95.8%. Similarly, the statistical analysis conducted on geographies consisting of 46,909,556 people shows a substantial positive correlation between the proportion of Finns and percentage of population with at least 7th grade education in the United States with a correlation coefficient (R) of 0.520 and weighted average of 98.5%, a difference of 2.8%.
7th Grade Correlation Summary
| Measurement | Navajo | Finnish |
| Minimum | 87.2% | 97.8% |
| Maximum | 100.0% | 100.0% |
| Range | 12.8% | 2.2% |
| Mean | 97.1% | 99.3% |
| Median | 97.6% | 99.2% |
| Interquartile 25% (IQ1) | 95.7% | 98.9% |
| Interquartile 75% (IQ3) | 99.4% | 99.7% |
| Interquartile Range (IQR) | 3.7% | 0.85% |
| Standard Deviation (Sample) | 2.8% | 0.57% |
| Standard Deviation (Population) | 2.8% | 0.57% |
Similar Demographics by 7th Grade
Demographics Similar to Navajo by 7th Grade
In terms of 7th grade, the demographic groups most similar to Navajo are Immigrants from Sudan (95.8%, a difference of 0.0%), African (95.8%, a difference of 0.010%), Dutch West Indian (95.8%, a difference of 0.010%), Hawaiian (95.8%, a difference of 0.010%), and Moroccan (95.8%, a difference of 0.020%).
| Demographics | Rating | Rank | 7th Grade |
| Argentineans | 23.2 /100 | #200 | Fair 95.9% |
| Immigrants | Argentina | 21.9 /100 | #201 | Fair 95.9% |
| Immigrants | Northern Africa | 21.4 /100 | #202 | Fair 95.8% |
| Comanche | 21.1 /100 | #203 | Fair 95.8% |
| Assyrians/Chaldeans/Syriacs | 20.5 /100 | #204 | Fair 95.8% |
| Moroccans | 18.9 /100 | #205 | Poor 95.8% |
| Africans | 17.6 /100 | #206 | Poor 95.8% |
| Navajo | 17.0 /100 | #207 | Poor 95.8% |
| Immigrants | Sudan | 17.0 /100 | #208 | Poor 95.8% |
| Dutch West Indians | 16.1 /100 | #209 | Poor 95.8% |
| Hawaiians | 16.0 /100 | #210 | Poor 95.8% |
| Portuguese | 13.6 /100 | #211 | Poor 95.8% |
| Immigrants | Lebanon | 13.0 /100 | #212 | Poor 95.8% |
| Immigrants | Morocco | 12.6 /100 | #213 | Poor 95.8% |
| Bahamians | 11.6 /100 | #214 | Poor 95.7% |
Demographics Similar to Finns by 7th Grade
In terms of 7th grade, the demographic groups most similar to Finns are Carpatho Rusyn (98.3%, a difference of 0.18%), Ottawa (98.1%, a difference of 0.37%), Dutch (97.9%, a difference of 0.64%), Crow (99.1%, a difference of 0.65%), and Tsimshian (97.8%, a difference of 0.71%).
| Demographics | Rating | Rank | 7th Grade |
| Crow | 100.0 /100 | #1 | Exceptional 99.1% |
| Finns | 100.0 /100 | #2 | Exceptional 98.5% |
| Carpatho Rusyns | 100.0 /100 | #3 | Exceptional 98.3% |
| Ottawa | 100.0 /100 | #4 | Exceptional 98.1% |
| Dutch | 100.0 /100 | #5 | Exceptional 97.9% |
| Tsimshian | 100.0 /100 | #6 | Exceptional 97.8% |
| Norwegians | 100.0 /100 | #7 | Exceptional 97.8% |
| Slovaks | 100.0 /100 | #8 | Exceptional 97.8% |
| Germans | 100.0 /100 | #9 | Exceptional 97.7% |
| Slovenes | 100.0 /100 | #10 | Exceptional 97.6% |
| Alaskan Athabascans | 100.0 /100 | #11 | Exceptional 97.6% |
| Poles | 100.0 /100 | #12 | Exceptional 97.6% |
| Swedes | 100.0 /100 | #13 | Exceptional 97.6% |
| Pennsylvania Germans | 100.0 /100 | #14 | Exceptional 97.6% |
| English | 100.0 /100 | #15 | Exceptional 97.6% |