Immigrants from Honduras vs Finnish 7th Grade
COMPARE
Immigrants from Honduras
Finnish
7th Grade
7th Grade Comparison
Immigrants from Honduras
Finns
92.5%
7TH GRADE
0.0/ 100
METRIC RATING
336th/ 347
METRIC RANK
98.5%
7TH GRADE
100.0/ 100
METRIC RATING
2nd/ 347
METRIC RANK
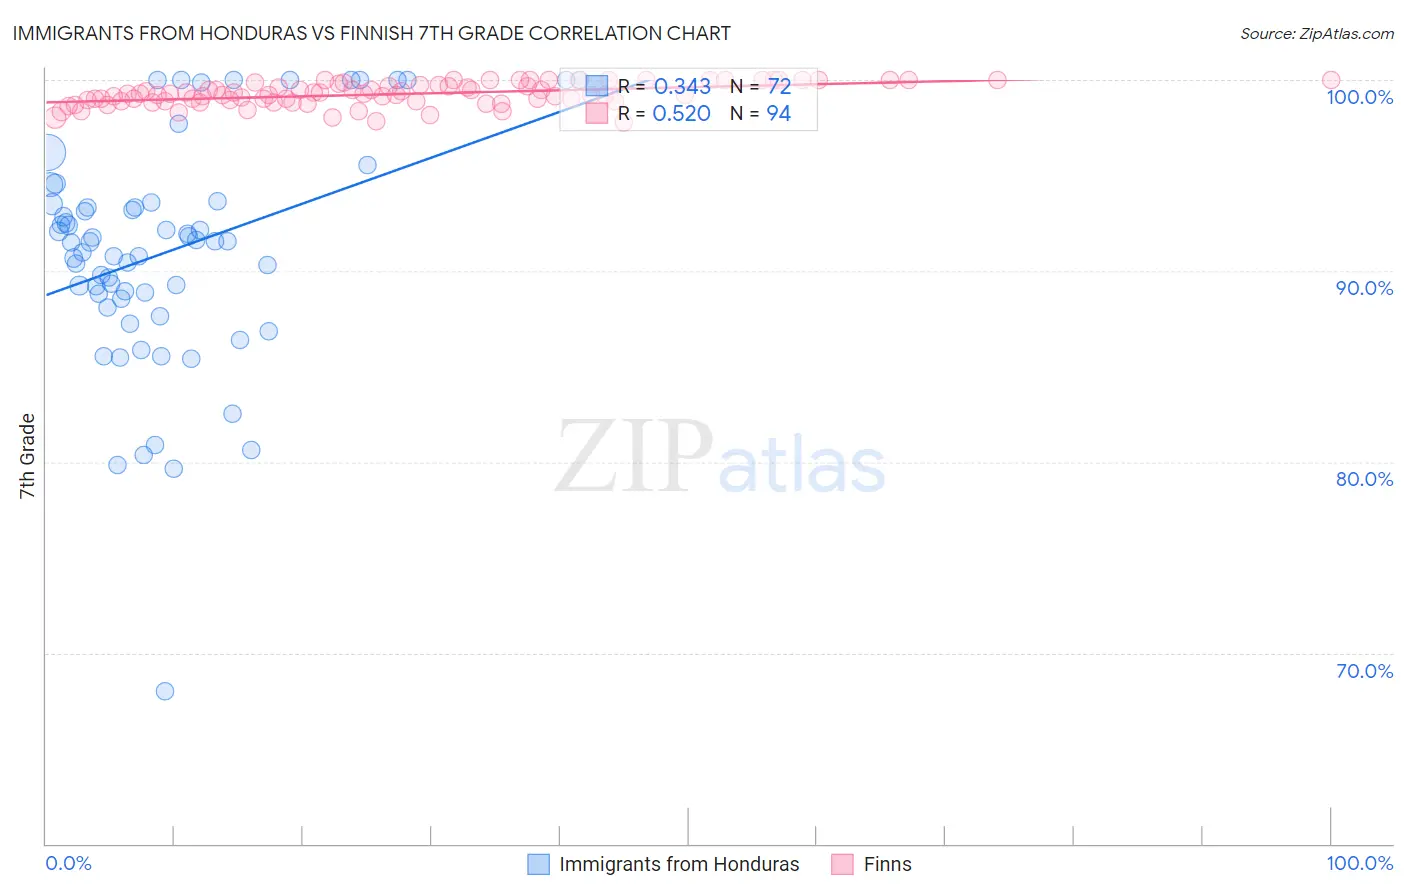
Immigrants from Honduras vs Finnish 7th Grade Correlation Chart
The statistical analysis conducted on geographies consisting of 322,637,445 people shows a mild positive correlation between the proportion of Immigrants from Honduras and percentage of population with at least 7th grade education in the United States with a correlation coefficient (R) of 0.343 and weighted average of 92.5%. Similarly, the statistical analysis conducted on geographies consisting of 46,909,556 people shows a substantial positive correlation between the proportion of Finns and percentage of population with at least 7th grade education in the United States with a correlation coefficient (R) of 0.520 and weighted average of 98.5%, a difference of 6.5%.
7th Grade Correlation Summary
| Measurement | Immigrants from Honduras | Finnish |
| Minimum | 68.0% | 97.8% |
| Maximum | 100.0% | 100.0% |
| Range | 32.0% | 2.2% |
| Mean | 91.0% | 99.3% |
| Median | 91.6% | 99.2% |
| Interquartile 25% (IQ1) | 88.7% | 98.9% |
| Interquartile 75% (IQ3) | 93.5% | 99.7% |
| Interquartile Range (IQR) | 4.9% | 0.85% |
| Standard Deviation (Sample) | 5.9% | 0.57% |
| Standard Deviation (Population) | 5.9% | 0.57% |
Similar Demographics by 7th Grade
Demographics Similar to Immigrants from Honduras by 7th Grade
In terms of 7th grade, the demographic groups most similar to Immigrants from Honduras are Mexican American Indian (92.6%, a difference of 0.070%), Immigrants from Yemen (92.6%, a difference of 0.17%), Immigrants from Armenia (92.7%, a difference of 0.25%), Hispanic or Latino (92.7%, a difference of 0.27%), and Immigrants from Latin America (92.2%, a difference of 0.27%).
| Demographics | Rating | Rank | 7th Grade |
| Immigrants | Azores | 0.0 /100 | #329 | Tragic 93.0% |
| Immigrants | Dominican Republic | 0.0 /100 | #330 | Tragic 92.9% |
| Hondurans | 0.0 /100 | #331 | Tragic 92.9% |
| Hispanics or Latinos | 0.0 /100 | #332 | Tragic 92.7% |
| Immigrants | Armenia | 0.0 /100 | #333 | Tragic 92.7% |
| Immigrants | Yemen | 0.0 /100 | #334 | Tragic 92.6% |
| Mexican American Indians | 0.0 /100 | #335 | Tragic 92.6% |
| Immigrants | Honduras | 0.0 /100 | #336 | Tragic 92.5% |
| Immigrants | Latin America | 0.0 /100 | #337 | Tragic 92.2% |
| Central Americans | 0.0 /100 | #338 | Tragic 92.1% |
| Mexicans | 0.0 /100 | #339 | Tragic 91.9% |
| Yakama | 0.0 /100 | #340 | Tragic 91.7% |
| Guatemalans | 0.0 /100 | #341 | Tragic 91.7% |
| Salvadorans | 0.0 /100 | #342 | Tragic 91.5% |
| Immigrants | Guatemala | 0.0 /100 | #343 | Tragic 91.3% |
Demographics Similar to Finns by 7th Grade
In terms of 7th grade, the demographic groups most similar to Finns are Carpatho Rusyn (98.3%, a difference of 0.18%), Ottawa (98.1%, a difference of 0.37%), Dutch (97.9%, a difference of 0.64%), Crow (99.1%, a difference of 0.65%), and Tsimshian (97.8%, a difference of 0.71%).
| Demographics | Rating | Rank | 7th Grade |
| Crow | 100.0 /100 | #1 | Exceptional 99.1% |
| Finns | 100.0 /100 | #2 | Exceptional 98.5% |
| Carpatho Rusyns | 100.0 /100 | #3 | Exceptional 98.3% |
| Ottawa | 100.0 /100 | #4 | Exceptional 98.1% |
| Dutch | 100.0 /100 | #5 | Exceptional 97.9% |
| Tsimshian | 100.0 /100 | #6 | Exceptional 97.8% |
| Norwegians | 100.0 /100 | #7 | Exceptional 97.8% |
| Slovaks | 100.0 /100 | #8 | Exceptional 97.8% |
| Germans | 100.0 /100 | #9 | Exceptional 97.7% |
| Slovenes | 100.0 /100 | #10 | Exceptional 97.6% |
| Alaskan Athabascans | 100.0 /100 | #11 | Exceptional 97.6% |
| Poles | 100.0 /100 | #12 | Exceptional 97.6% |
| Swedes | 100.0 /100 | #13 | Exceptional 97.6% |
| Pennsylvania Germans | 100.0 /100 | #14 | Exceptional 97.6% |
| English | 100.0 /100 | #15 | Exceptional 97.6% |