Immigrants from West Indies vs Finnish 7th Grade
COMPARE
Immigrants from West Indies
Finnish
7th Grade
7th Grade Comparison
Immigrants from West Indies
Finns
94.8%
7TH GRADE
0.0/ 100
METRIC RATING
292nd/ 347
METRIC RANK
98.5%
7TH GRADE
100.0/ 100
METRIC RATING
2nd/ 347
METRIC RANK
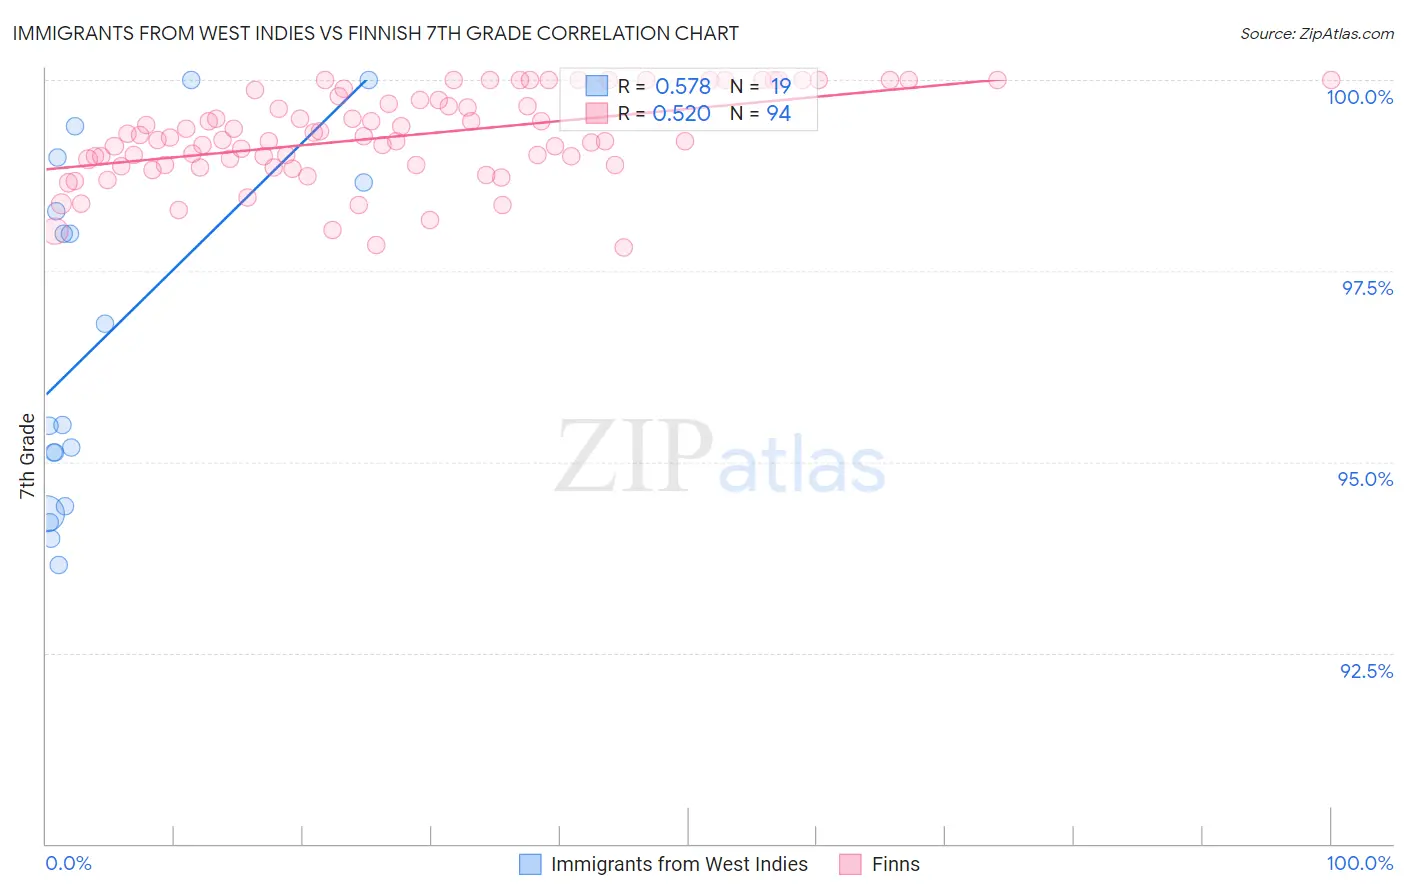
Immigrants from West Indies vs Finnish 7th Grade Correlation Chart
The statistical analysis conducted on geographies consisting of 72,457,514 people shows a substantial positive correlation between the proportion of Immigrants from West Indies and percentage of population with at least 7th grade education in the United States with a correlation coefficient (R) of 0.578 and weighted average of 94.8%. Similarly, the statistical analysis conducted on geographies consisting of 46,909,556 people shows a substantial positive correlation between the proportion of Finns and percentage of population with at least 7th grade education in the United States with a correlation coefficient (R) of 0.520 and weighted average of 98.5%, a difference of 3.9%.
7th Grade Correlation Summary
| Measurement | Immigrants from West Indies | Finnish |
| Minimum | 93.7% | 97.8% |
| Maximum | 100.0% | 100.0% |
| Range | 6.3% | 2.2% |
| Mean | 96.6% | 99.3% |
| Median | 95.5% | 99.2% |
| Interquartile 25% (IQ1) | 94.4% | 98.9% |
| Interquartile 75% (IQ3) | 98.7% | 99.7% |
| Interquartile Range (IQR) | 4.2% | 0.85% |
| Standard Deviation (Sample) | 2.2% | 0.57% |
| Standard Deviation (Population) | 2.1% | 0.57% |
Similar Demographics by 7th Grade
Demographics Similar to Immigrants from West Indies by 7th Grade
In terms of 7th grade, the demographic groups most similar to Immigrants from West Indies are Immigrants from Grenada (94.8%, a difference of 0.020%), Fijian (94.7%, a difference of 0.020%), Malaysian (94.8%, a difference of 0.060%), Taiwanese (94.8%, a difference of 0.080%), and British West Indian (94.8%, a difference of 0.090%).
| Demographics | Rating | Rank | 7th Grade |
| Immigrants | Eritrea | 0.1 /100 | #285 | Tragic 94.9% |
| Immigrants | Philippines | 0.0 /100 | #286 | Tragic 94.9% |
| Immigrants | Peru | 0.0 /100 | #287 | Tragic 94.9% |
| British West Indians | 0.0 /100 | #288 | Tragic 94.8% |
| Taiwanese | 0.0 /100 | #289 | Tragic 94.8% |
| Malaysians | 0.0 /100 | #290 | Tragic 94.8% |
| Immigrants | Grenada | 0.0 /100 | #291 | Tragic 94.8% |
| Immigrants | West Indies | 0.0 /100 | #292 | Tragic 94.8% |
| Fijians | 0.0 /100 | #293 | Tragic 94.7% |
| Haitians | 0.0 /100 | #294 | Tragic 94.7% |
| Yaqui | 0.0 /100 | #295 | Tragic 94.6% |
| Cubans | 0.0 /100 | #296 | Tragic 94.6% |
| Immigrants | South Eastern Asia | 0.0 /100 | #297 | Tragic 94.5% |
| Indonesians | 0.0 /100 | #298 | Tragic 94.5% |
| Bangladeshis | 0.0 /100 | #299 | Tragic 94.5% |
Demographics Similar to Finns by 7th Grade
In terms of 7th grade, the demographic groups most similar to Finns are Carpatho Rusyn (98.3%, a difference of 0.18%), Ottawa (98.1%, a difference of 0.37%), Dutch (97.9%, a difference of 0.64%), Crow (99.1%, a difference of 0.65%), and Tsimshian (97.8%, a difference of 0.71%).
| Demographics | Rating | Rank | 7th Grade |
| Crow | 100.0 /100 | #1 | Exceptional 99.1% |
| Finns | 100.0 /100 | #2 | Exceptional 98.5% |
| Carpatho Rusyns | 100.0 /100 | #3 | Exceptional 98.3% |
| Ottawa | 100.0 /100 | #4 | Exceptional 98.1% |
| Dutch | 100.0 /100 | #5 | Exceptional 97.9% |
| Tsimshian | 100.0 /100 | #6 | Exceptional 97.8% |
| Norwegians | 100.0 /100 | #7 | Exceptional 97.8% |
| Slovaks | 100.0 /100 | #8 | Exceptional 97.8% |
| Germans | 100.0 /100 | #9 | Exceptional 97.7% |
| Slovenes | 100.0 /100 | #10 | Exceptional 97.6% |
| Alaskan Athabascans | 100.0 /100 | #11 | Exceptional 97.6% |
| Poles | 100.0 /100 | #12 | Exceptional 97.6% |
| Swedes | 100.0 /100 | #13 | Exceptional 97.6% |
| Pennsylvania Germans | 100.0 /100 | #14 | Exceptional 97.6% |
| English | 100.0 /100 | #15 | Exceptional 97.6% |